Question
Given below is the information about marks obtained in Mathematics and Statistics by 100 students in a class. Which subject shows the highest variability in marks?
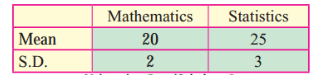
$\begin{aligned} \text { C.V. }(M) & =100 \times \frac{\sigma_m}{\bar{x}_m} \\ & =100 \times \frac{2}{20}=10 \%\end{aligned}$
C.V. $( S )=100 \times \frac{\sigma_5}{\bar{x}_5}=100 \times \frac{3}{25}=12 \%$
Since C.V. (S) > C.V. (M),
The subject statistics show higher variability in marks.
Generate a complete, print-ready paper with questions like this in minutes — across 16+ boards, with answer keys.