Question
he graph given below shows the marks obtained out of $10$ by Sonia in two different tests. Study the graph and answer the questions that follow.
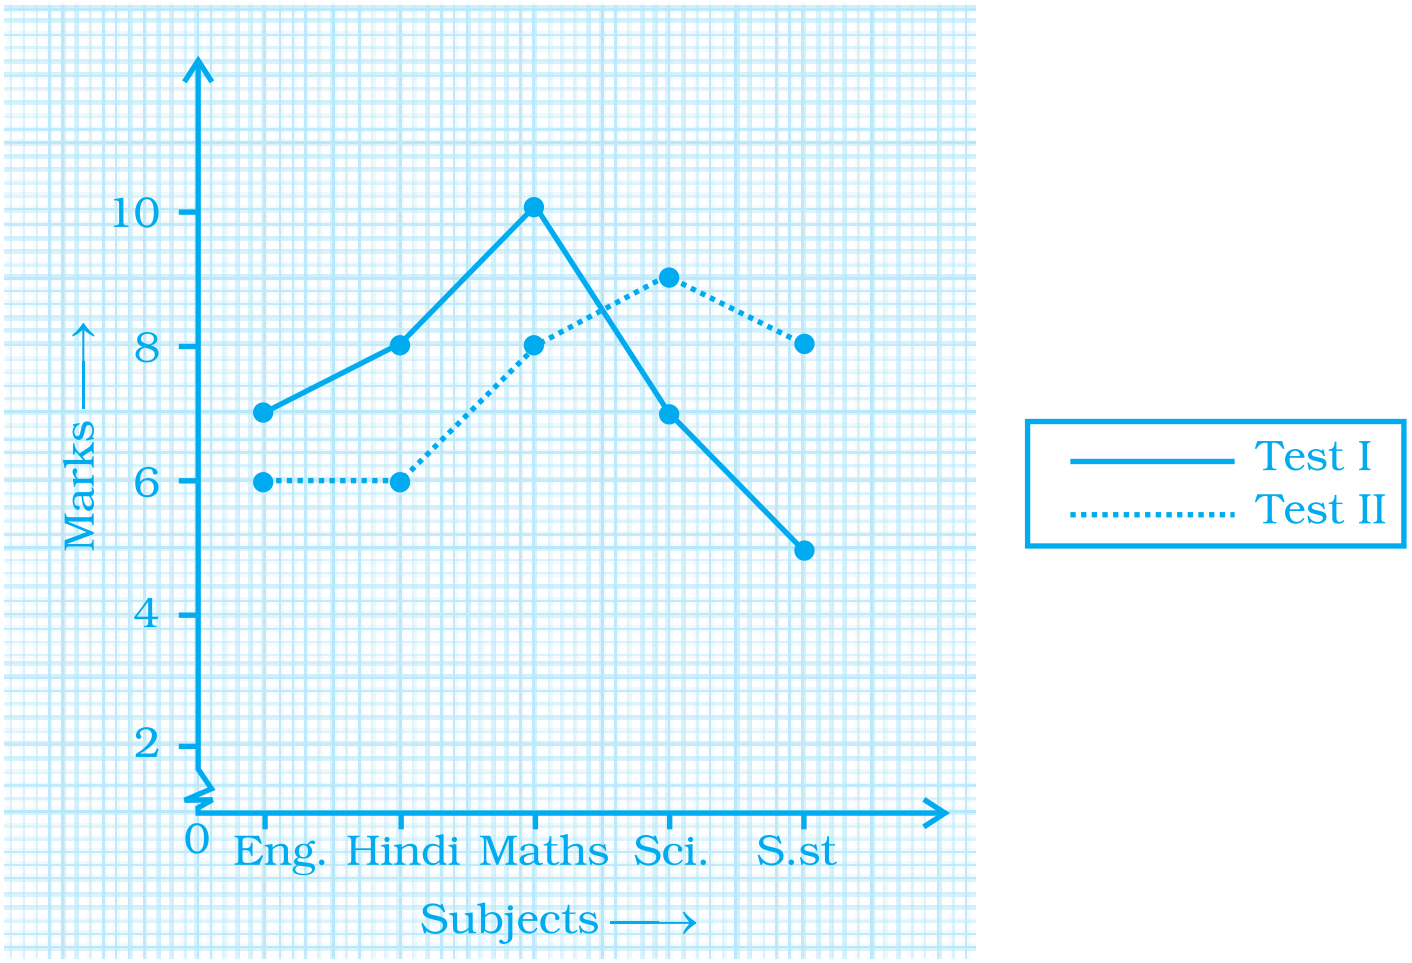
$a.$ What information is represented by the axes?
$b.$ In which subject did she score the highest in Test $I$?
$c.$ In which subject did she score the least in Test $II$?
$d.$ In which subject did she score the same marks in both the Tests?
$e.$ What are the marks scored by her in English in Test $II$?
$f.$ In which test was the performance better?
$g.$ In which subject and which test did she score full marks?