Question
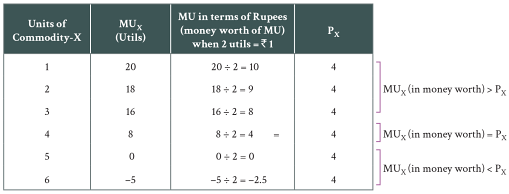
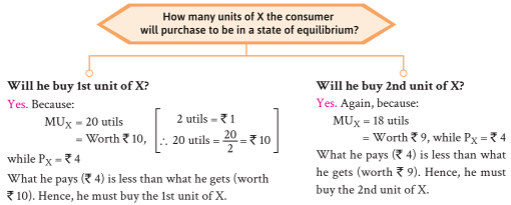
How does a consumer reach equilibrium position when he is buying only one commodity? Explain with the help of marginal utility schedule.

Answer

Now, we address the basic question of this chapter: How much of a commodity a consumer buys so that he maximises his satisfaction and attains the point of equilibrium? This is discussed with reference to two different situations:
(i) when only one commodity is consumed, and
(ii) when two or more commodities are consumed.
Following is brief description of both the situations.
Consumer's Equilibrium: One Commodity Case
Purchase of a commodity by a consumer depends on three factors:
(i) Price of the commodity.
(ii) Marginal (and total) utility of the commodity.
(iii) Marginal utility of money.
Assumptions for the illustration given below:
Let marginal utility of money for the consumer = 2 utils (referring to the utility he expects to receive when he spends ₹1).
Let X be the commodity he intends to buy.
Let $P_X$ (Price of X) = ₹4 per unit.
Marginal Utility Schedule of X is taken to be as follows:
Calculation of MU in terms of Rupees, given Marginal Utility Schedule of Commodity-X
Image
Using the scale that 2 utils₹1, MU in terms of rupees is calculated as shown above.
Now comes the basic question: How many units of X the consumer will purchase to be in a state of equilibrium?
Image

Continuing like this, he will stop buying X, only when:
$MU _{ x }$(in terms of rupees) = $P _{ X }$
It occurs when the consumer buys 4 units of commodity-X. Here,
$MU _{ x }$(in terms of rupees) = $P _{ X }$= ₹4

Need a full question paper?

Generate a complete, print-ready paper with questions like this in minutes — across 16+ boards, with answer keys.

Start Generating Free

Similar questions

Construct Index of Industrial Production (IIP) from the following data:
Industry
Output
Weights
Base year
Current Year
Manufacturing
122
300
85
Electrical Product
203
400
5
Mining and Quarrying
65
87
10
Which factors will you consider in determining sample size? Explain.
Differentiate between Short Period and Long period.
Explain the effect of increase in income of the consumer on the demand for a good.
In a singing competition, two judges rank seven contestants as following:
Judge 1
5
6
7
3
1
2
6
Judge 2
6
5
2
1
3
4
7
Calculate the coefficient of rank correlation.
Calculate weighted average of price relative index from the following data:
Item
Weight in %
Base Year Price (₹)
Current Year Price (₹)
A
40
2
4
B
30
5
6
C
20
4
5
D
10
2
3
What are the qualities of a good questionnaire?
Find out range and coefficient of range from the following data.
Marks: 20-29 30-39 40-49 50-59 60-69
Number of Students: 8 12 20 7 3
Hint: As per the question, inclusive series of marks and number of students are given. For calculating range and coefficient of range, firstly we will convert inclusive series into exclusive series and after that we will compute range.
Find out the price index of the year 2015 assuming 2014 as the base year of the following data by using simple average of price relative method.
Commodity Price in 2014 (₹) Per Quintal Price in 2015 (₹) Per Quintal
Wheat 800 900
Sugar 1100 1200
Rice 400 600
Potato 500 700
Salt 300 500
Represent the following data by an appropriate bar diagram.
Import and Export of India
Year
Impoet in Current Price (₹ in thousand crore)
Export in Current Price (₹ in thousand crore)
2002-03
139
119
2003-04
154
130
2004-05
176
142
2005-06
149
119