Question
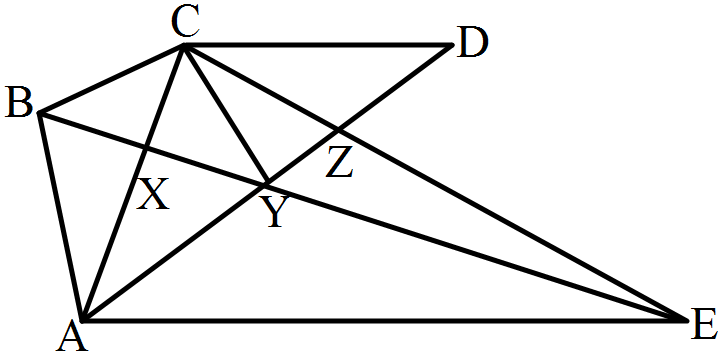
In □ABCD, side BC < side AD, side BC || side AD and if side BA ≅ side CD, then prove that ∠ABC = ∠DCB.

Image
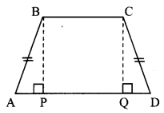
Given: side BC < side AD, side BC || side AD, side BA = side CD
To prove: ∠ABC ≅ ∠DCB
Construction: Draw seg BP ⊥ side AD, A – P – D
seg CQ ⊥ side AD, A – Q – D

Answer

Proof:
In ∆BPA and ∆CQD,
∠BPA ≅ ∠CQB [Each angle is of measure 90°]
Hypotenuse BA ≅ Hypotenuse CD [Given]
seg BP ≅ seg CQ [Perpendicular distance between two parallel lines]
∴ ∆BPA ≅ ∆CQD [Hypotenuse side test]
∴ ∠BAP ≅ ∠CDQ [c. a. c. t.]
∴ ∠A = ∠D ….(i)
Now, side BC || side AD and side AB is their transversal. [Given]
∴ ∠A + ∠B = 180°…..(ii) [Interior angles]
Also, side BC || side AD and side CD is their transversal. [Given]
∴ ∠C + ∠D = 180° …..(iii) [Interior angles]
∴ ∠A + ∠B = ∠C + ∠D [From (ii) and (iii)]
∴ ∠A + ∠B = ∠C + ∠A [From (i)]
∴ ∠B = ∠C
∴ ∠ABC ≅ ∠DCB

Need a full question paper?

Generate a complete, print-ready paper with questions like this in minutes — across 16+ boards, with answer keys.

Start Generating Free

Similar questions

ABC is a triangle. The bisector of the exterior angle at B and the bisector of $\angle\text{C}$ intersect each other at D. Prove that $\angle\text{D}=\frac{1}{2}\angle\text{A}.$
The following data gives the amount of manure (in thousand tonnes) manufactured by a company during some years:
Year
1992
1993
1994
1995
1996
1997
Manure (in thousand tonnes)
15
35
45
30
40
20
  1. Represent the above data with the help of a bar graph.
  2. Indicate with the help of the bar graph the year in which the amount of manufactured by the company was maximum.
  3. Choose the correct alternative:
The consecutive years during which there was the maximum decrease in manure production are:
  1. 1994 and 1995
  2. 1992 and 1993
  3. 1996 and 1997
  4. 1995 and 1996
Write the answers to the following questions with reference to the figure given below:

Image
i. Write the name of the opposite ray of ray RP
ii. Write the intersection set of ray PQ and ray RP.
iii. Write the union set of ray PQ and ray QR.
iv. State the rays of which seg QR is a subset.
v. Write the pair of opposite rays with common end point R.
vi. Write any two rays with common end point S.
vii. Write the intersection set of ray SP and ray ST.

Divide each of the following polynomials by synthetic division method and also by linear division method. Write the quotient and the remainder : $(x^4 – 3x^2 – 8) ÷ (x + 4)$
A farmer has produced Wheat and Jowar in his field. The following joint bar diagram shows the production of Wheat and Jowar. From the gken diagram answer the following questions:
i. Which crop production has increased consistently in 3 years?
ii. By how many quintals the production ofjowar has reduced in 2012 as compared to 2011?
iii. What is the difference between the production of wheat in 2010 and 2012 ?
iv. Complete the following table using this diagram.

Image

Image

Construct ∆XYZ such that XY = 6.7 cm, YZ = 5.8 cm, XZ = 6.9 cm. Construct its incircle.
For the above Question prepare Frequency Distribution Table.
On a graph paper, plot the points (0, 1), (1, 3), (2, 5). Are they collinear? If so, draw the line that passes through them.
i. Through which quadrants does this line pass ?
ii. Write the co-ordinates of the point at which it intersects the Y-axis.
iii. Show any point in the third quadrant which lies on this line. Write the co-ordinates of the point.
On a graph paper, plot the points A(2, 3), B(6, -1) and C(0, 5). If these points are collinear, then draw the line which includes them. Write the co-ordinates of the points at which the line intersects the X-axis and the Y-axis.
In the given figure, CD || AE and CY || BA.
  1. Name a triangle equal in area of $\triangle\text{CBX}$
  2. Prove that $\text{ar}(\triangle\text{ZDE})=\text{ar}(\triangle\text{CZA})$
  3. Prove that $\text{ar}(\text{BCZY})=\text{ar}(\triangle\text{EDZ}).$