MCQ
In the figure below, D and E respectively represent
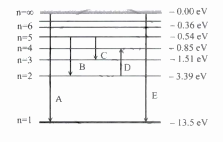
- ✓Absorption line of Balmer series and the ionization potential of hydrogen.
- BAbsorption line of Balmer series and the wavelength lesser than lowest of the Lyman series.
- CSpectral line of Balmer series and the maximum wavelength of Lyman series.
- DSpectral line of Lyman series and the absorption of greater wavelength of limiting value of Paschen series.