Question
Look at the bar graph given below:
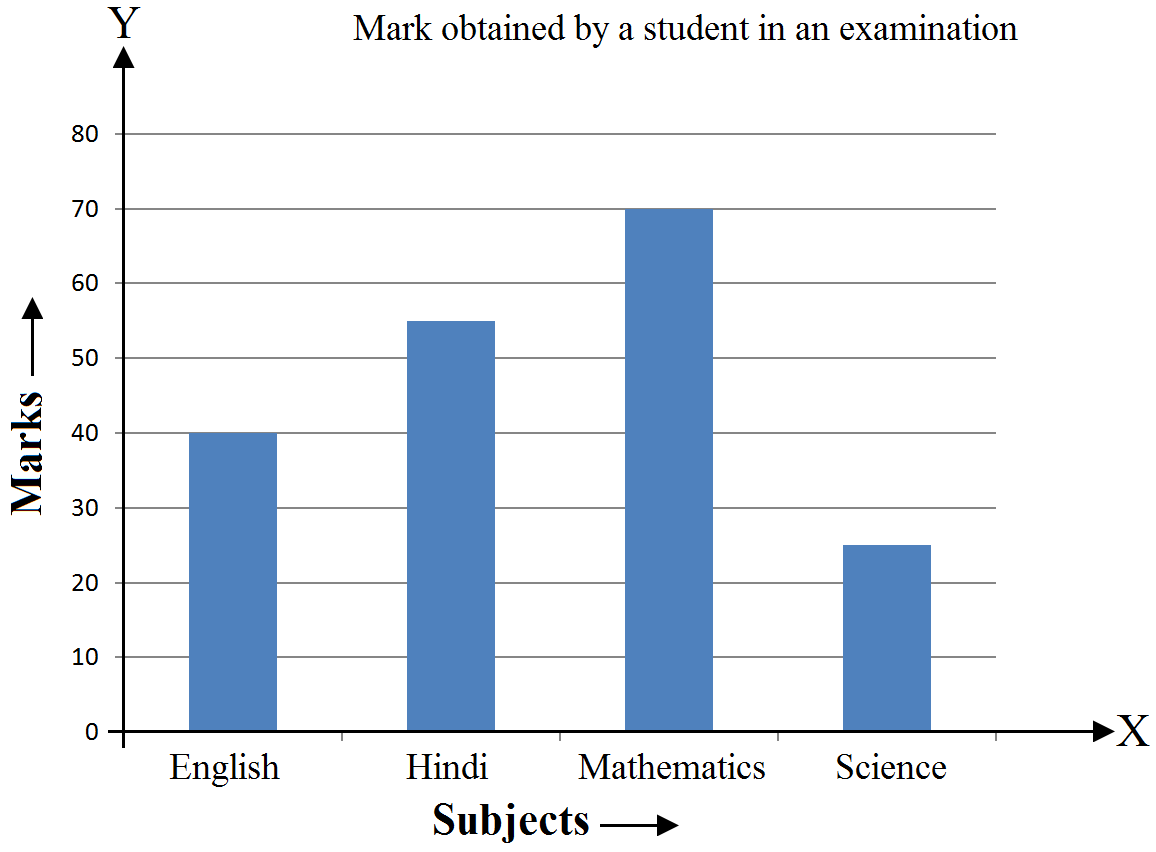
Read it carefully and answer the questions given below:
  1. What information does the bar graph give?
  2. In which subject is the student poorest?
  3. In which subject is the student best?
  4. In which subject did he get more than 40 marks?

Answer

  1. The given bar graph shows the marks obtained by a student in each of the four subjects in an examination.
  2. The student is poorest in Science.
  3. The student is best in Mathematics.
  4. He got more than 40 marks in Hindi and Mathematics.

Need a full question paper?

Generate a complete, print-ready paper with questions like this in minutes — across 16+ boards, with answer keys.

Start Generating Free