Question

Look at the map given in Fig. The major primary occupations in Brazil are shown here. Discuss the following points and write your observations.Image
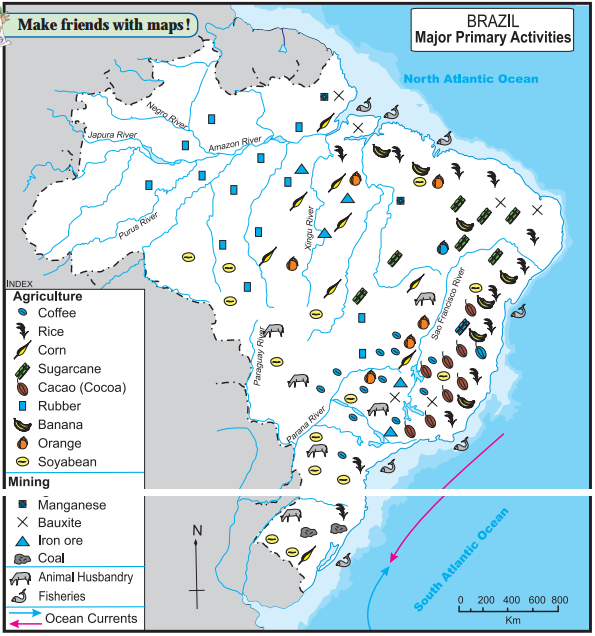
(1) In which part of Brazil is coffee mainly produced?
(2) Which food crops are mainly produced in Brazil?
(3) Can you relate the production of these crops with the climate there?
(4) Where are the rubber plantations concentrated?
(5) Complete the table.
Types of crops Crops Areas of Prodution
Food crops    
   
Cash crops    


Fruits and Vegetables    
   

Answer

A-1 Coffee is mainly produced in the South and South-east part of Brazil.
A-2 Rice, soyabean and corn are the food crops mainly produced in Brazil.
A-3
  • Brazil has a wide range of climatic variation.
  • Rice requires hot and humid climate with heavy rainfall. So it is grown in the coastal region.
  • Corn grows well in the central parts of Brazil, because the climate there is hot and dry.
A-4 The rubber plantations are concentrated in the north western part in the Amazon River Basin area.
A-5
Types of crops Crops Areas of Prodution
Food crops Corn / Maize Central
Rice coastal region
Cash crops Coffee South east
Sugarcane Central, East
Cocoa East
Rubber North
Soyabean South
Fruits and Vegetables Bananas coastal region.
Oranges East, Central

Need a full question paper?

Generate a complete, print-ready paper with questions like this in minutes — across 16+ boards, with answer keys.

Start Generating Free

Similar questions

Show the following on a given outline map of Brazil.
Given index:(A) Ports:
  • Vitoria
  • Manaus
(B) Airports:
  • Brasilia
  • Campo Grande
(C) Railway Junctions:
  • Sao Paulo
  • Rio de Janeiro
Observe the given map carefully and answer the following questions:
Image
(1) What does the map indicate ?
(2) Which part of India has many airports compared to the others?
(3) Which part of India has a dense network of rail routes?
(4) Name the northernmost important railway station.
(5) Name the easternmost important railway station.
(6) Name the two westernmost important railway stations.
Comment upon the population density of fig (b).
(i) fig (b) shows the population density of India as per 2011.
(ii) The density of population is divided into four categories. They are:
(a) Less than 100 persons per sq.km. .
(b) 101-250 persons per sq.km.
(c) 251-500 persons per sq.km.
(d) more than 500 persons per sq.km.
Look at the graph and answer the following questions:

Image
(1) What type of graph is shown here?
(2) What does the graph show?
(3) Which country’s tourism has a larger share in the contribution towards GDP?
(4) Which country has a larger population engaged in tourism sector but contributes lesser in GDP?
(5) How much percentage of India’s population is engaged in tourism?
(6) How much is the contribution of tourism in India’s GDP in 2016?

Show the following on a given outline map of India. Give index:
Given index:
(A) Ports:

  • Chennai
  • Porbandar
  • Kochin
  • Kandla
  • Kolkata

(B) Airports :

  • Bengaluru
  • Delhi
  • Pune
  • Thiruvananthapuram

(C) Railway Junctions :

  • Mumbai
  • Itarsi
  • Kota
  • Nagpur
Study the choropleth map of Brazil showing the Statewise urban population of Brazil and answer the following questions :

Image
(1) Which state (region) in Brazil is the most urbanised?
(2) Which state (region) in the least urbanised?

Look at the graph and answer the following questions
Image
(1) Which country attracted more international tourists in the year 1995?
(2) In which country did more international tourists arrive in the year 2000?
(3) In which year can an increase be seen in the number of international tourists in India?
(4) What was the number of international tourists in the year 2015 in both the countries? What was the difference between them?
(5) What could be the reason of increase in tourists in India after the year 2010?
(6) Name the kind of graph shown above.
Mark the following on an outline map of Brazil. Name the following:
  1. The new capital city of Brazil.
  2. Two cities that attract a lot of tourist.
  3. A south-flowing river important for waterways.
  4. The easternmost extreme point of mainland Brazil.
  5. The westernmost extreme point part of mainland Brazil.
In the figure (a) and (b), you can see images of two settlements in Brazil. One is from the Amazon river basin in Brazil while the other belongs to the coastal area. Observe the settlement patterns carefully and name the types of settlement patterns. Write a comment on their density and types.
Image

Image
(1) States with the highest population density.
(2) On the basis of maps given above, classify the distribution population in India in the following table.
(3) States with lowest population density.
(4) Correlate the climate and physiography of India with its population distribution and write a note on it.