Question
Observe the given graph and answer the following questions:
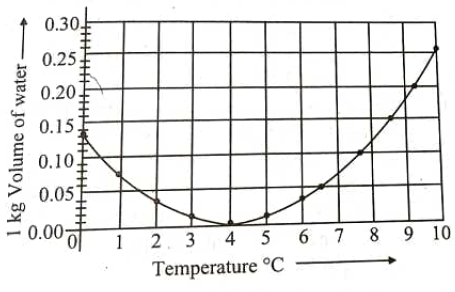
i. Name the process represented in the figure.
ii. At what temperature does this process take place?
i. Name the process represented in the figure.
ii. At what temperature does this process take place?