MCQ
Observe the graph and select the correct option.
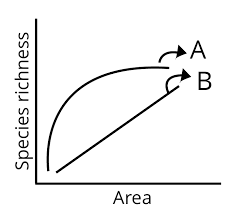
- ALine $A$ represents, $S = CA^2$
- BLine $B$ represents, $\log C = \log A + Z \log S$
- ✓Line $A$ represents, $S = CA^Z$
- DLine $B$ represents, $\log S = \log Z + C \log A$
Generate a complete, print-ready paper with questions like this in minutes — across 16+ boards, with answer keys.