Question
Plot a graph showing variation of de Broglie wavelength $(\lambda)$ associated with a charged particle of mass m, versus $\frac{1}{\sqrt{\text{V}}},$ where V is the potential difference through which the particle is accelerated. How does this graph give us the information regarding the magnitude of the charge of the particle?
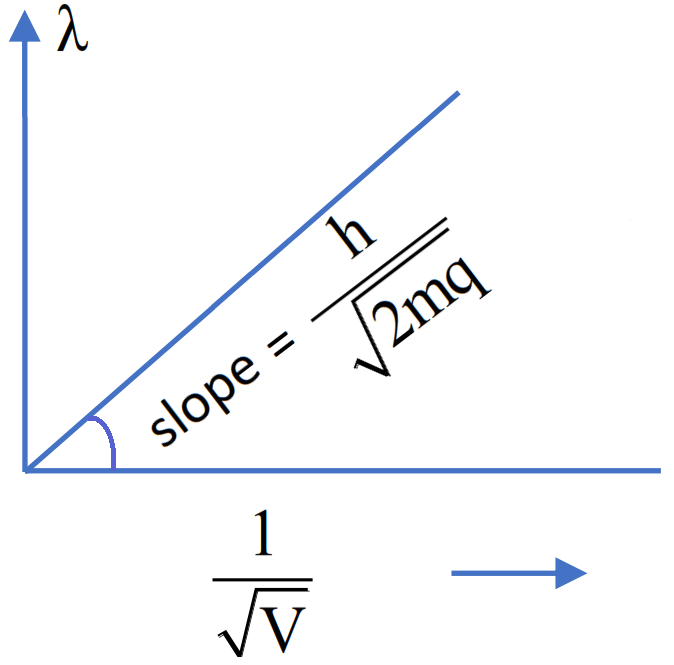 The slope of the graph is $\frac{\text{h}}{\sqrt{2\text{mq}}}.$ Considering we know slope and mass of the charged particle, we can easily calculate the charge.