Question
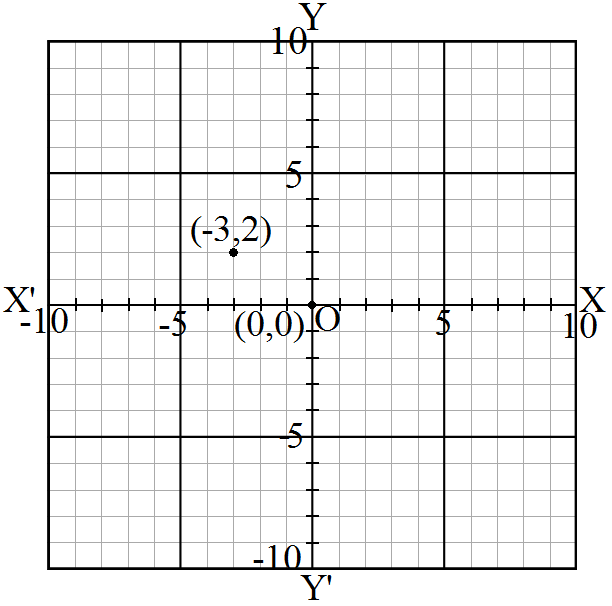
Plot the following points on the graph paper:(-3, 2)
Generate a complete, print-ready paper with questions like this in minutes — across 16+ boards, with answer keys.
|
No. of heads per toss
|
No. of tosses
|
|
0
|
38
|
|
1
|
144
|
|
2
|
342
|
|
3
|
287
|
|
4
|
164
|
|
5
|
25
|
|
Total
|
1000
|
|
Year
|
1995
|
1996
|
1997
|
1998
|
19999
|
2000
|
|
Production (in thousand tonnes)
|
120
|
150
|
140
|
180
|
170
|
190
|