Question
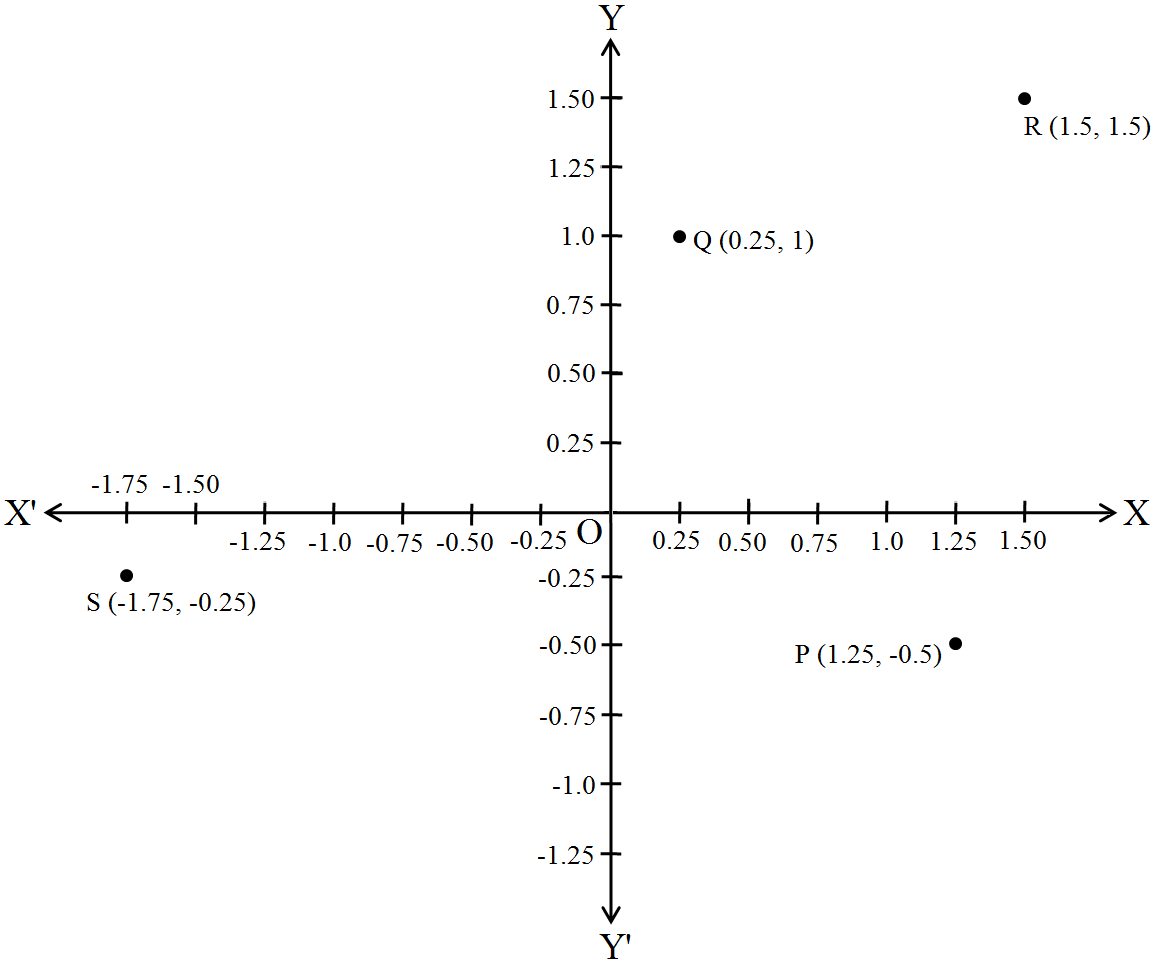
Plot the points (x, y) given by the following table. Use scale 1cm = 0.25 units.
x
1.25
0.25
1.5
-1.75
y
-0.5
1
1.5
-0.25

Answer

Let X’OX and X’ OX be the coordinate axes. Plot the given points (1.25, -0.5), (0.25, 1), (1.5,1.5) and (-1.75, -0.25) on the graph paper.

Need a full question paper?

Generate a complete, print-ready paper with questions like this in minutes — across 16+ boards, with answer keys.

Start Generating Free