Question
Population census in India is conducted every 10 years. The first complete census was taken in 1881 and the 15th decennial census was taken in 2011. The 16th decennial census was to be conducted in 2021 but due to COVID it will be taken in 2022. The data obtained from the census of a town has been represented by a bar graph shown in Fig. 17.2. It represents the number of persons in various age groups in the town. Observe the bar graph and answer the following questions:
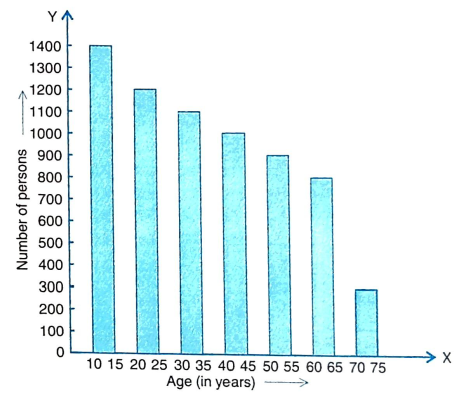
(i) What is the total number of persons living in the town in the age-groups 10-15 and 60 - 65?
(a) 2000$\quad$ (b) 2200$\quad$ (c) 2100$\quad$ (d) 1900
(ii) How many persons are more in the age-group 10 - 15 than in the age group 30-35?
(a) 200$\quad$ (b) 250$\quad$ (c) 300$\quad$ (d) 350
(iii) What is the total population of the town?
(a) 6700$\quad$ (b) 6400$\quad$ (c) 7700$\quad$ (d) 6600
(iv) What is the number of persons in the age-group 60-65?
(a) 900$\quad$ (b) 750$\quad$ (c) 850$\quad$ (d) 800