Question
Read the bar graph given below and answer the following questions: Scale: $1$ unit $=\ 50$ students 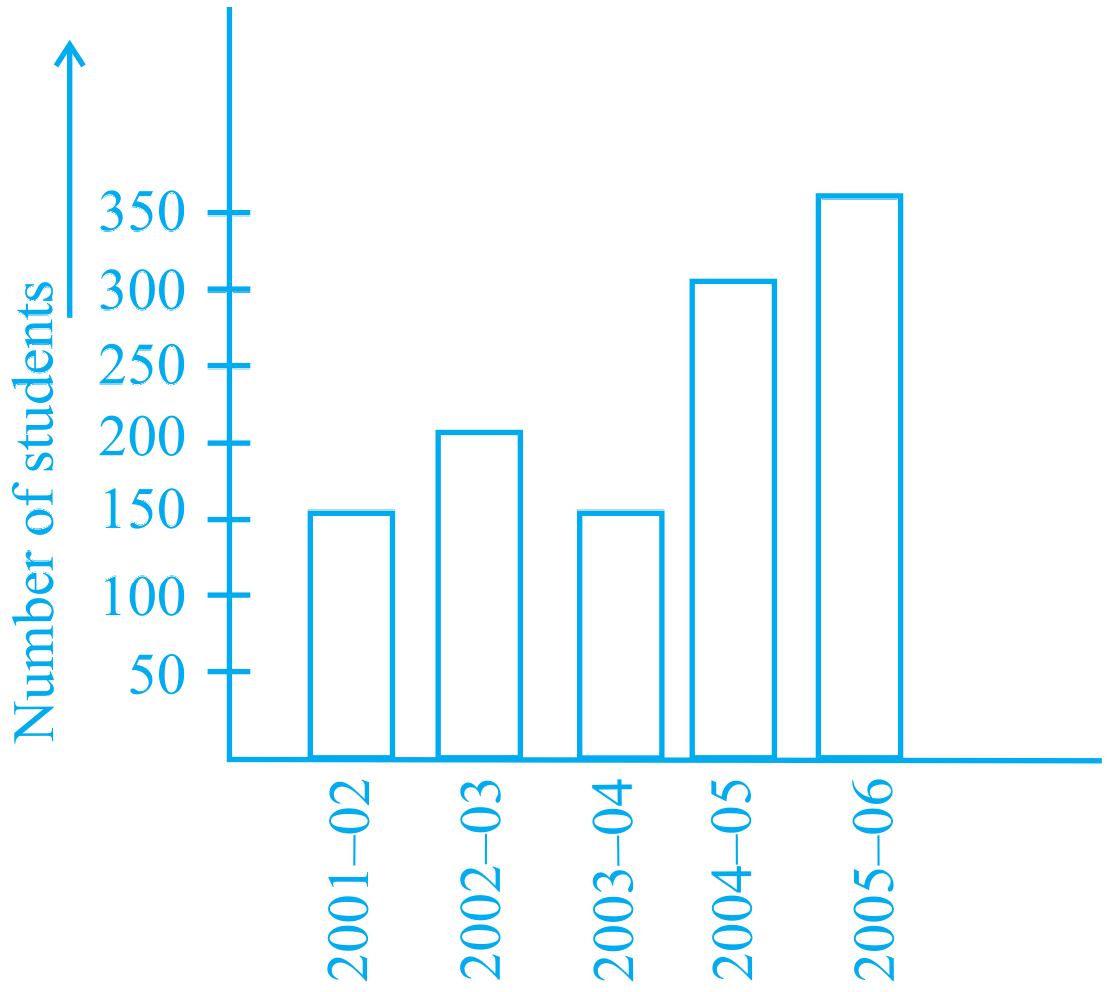
$a.\ $ What information is given by the bar graph$?$
$b.\ $ In which year is the number of students maximum$?$
$c.\ $ In which year is the number of students twice as that of $2001-02?$
$d.\ $ In which year did the number of students decrease as compared to previous year$?$
$e.\ $ In which year is the increase in number of students maximum as compared to the previous year$?$
