Question
Read the bar graph given in and answer the following questions:
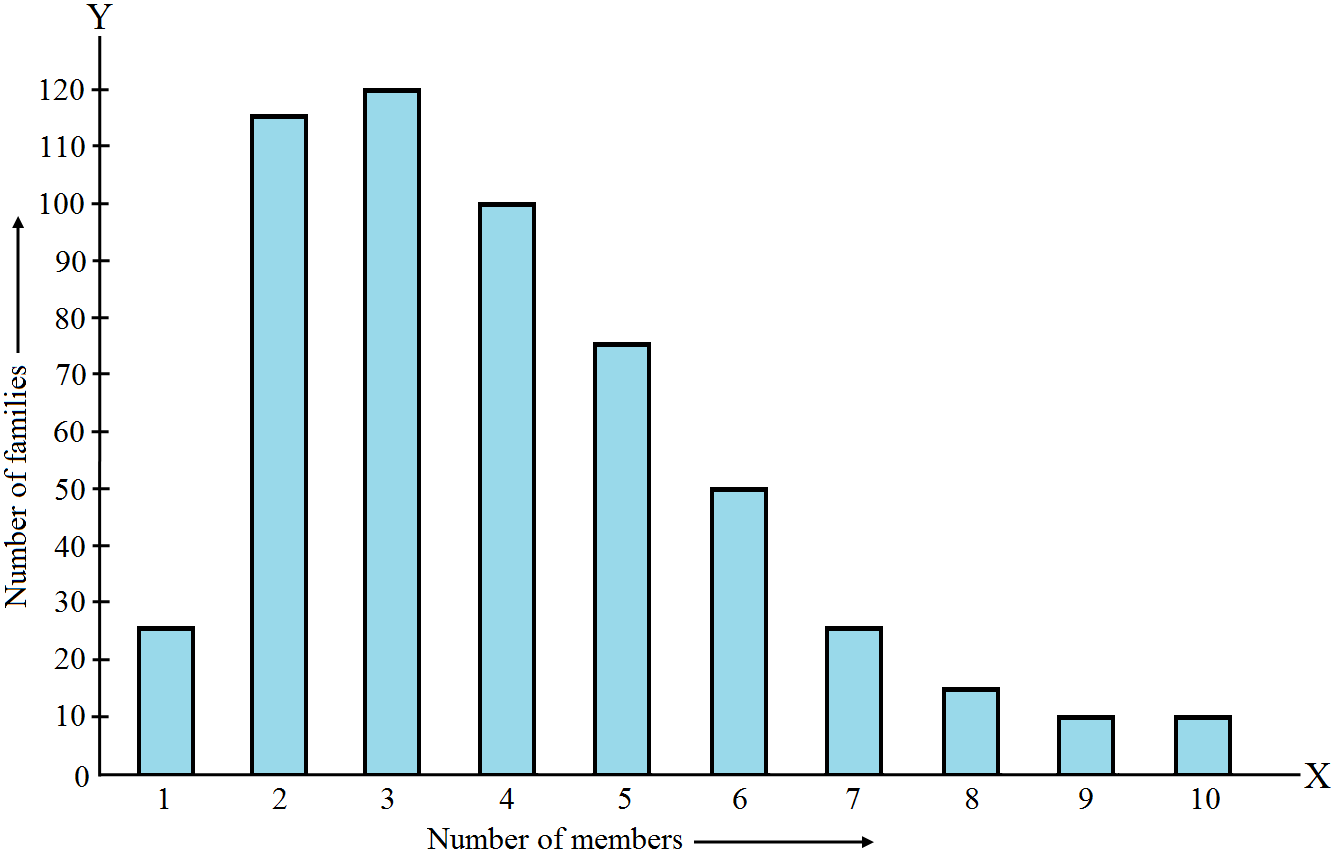
  1. What information is given by the bar graph?
  2. What was the crop-production of rice in 1970–71?
  3. What is the difference between the maximum and minimum production of rice?

Answer

i. The bar graph represents the production of the rice crop in India in different years.
ii. According to the height of the $3^{\text {rd }}$ bar from the left, the crop-production of rice in 1970-71 is 42.5 lakh tones.
iii. The maximum product of rice is 55 lakh tones (height of the $4^{\text {th }}$ bar from the left) in the year 1980-81 and the minimum product of rice is 22 lakh tones (height of the $1^{\text {st }}$ bar from the left) in the year 1950-51. Hence, the difference between maximum and minimum production of rice (in lakh tones) is $55-22=33$

Need a full question paper?

Generate a complete, print-ready paper with questions like this in minutes — across 16+ boards, with answer keys.

Start Generating Free