Question
Read the graph given in figure and answer the following question:
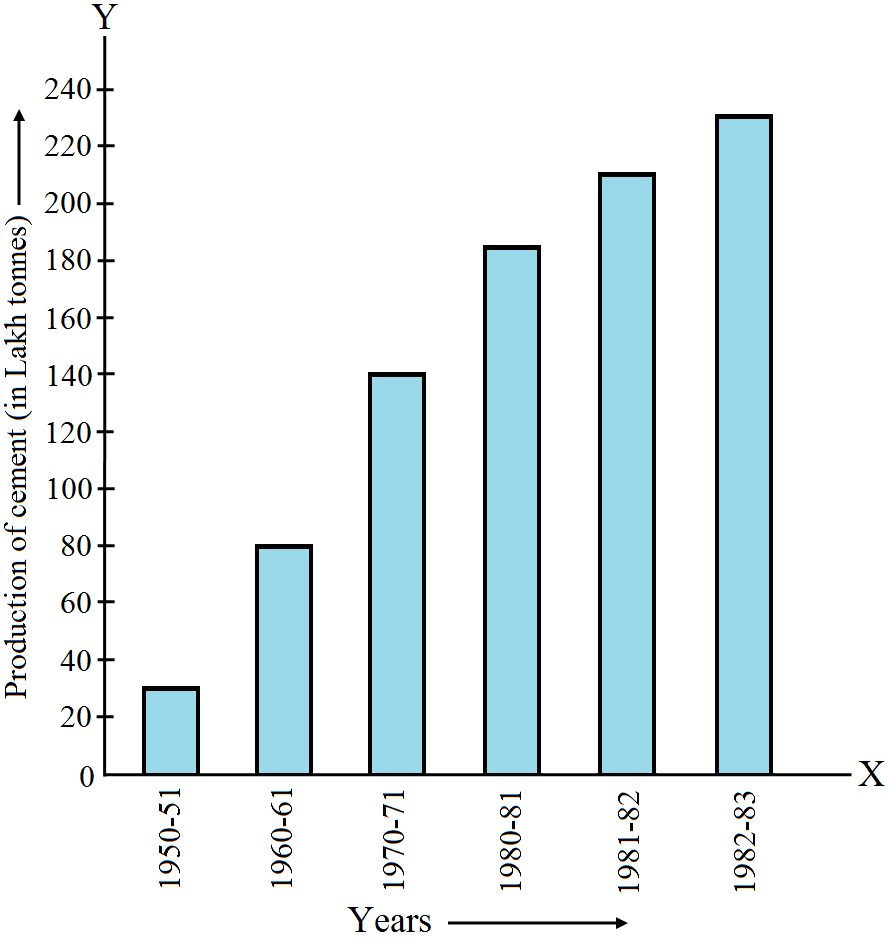
$i.$ What information is given by the bar given?
$iii.$ State whether true or false:
The area under sugarcane crop in the year $1982–83$ is three times that of the year $1950–51$.
$i.$ What information is given by the bar given?
$iii.$ State whether true or false:
The area under sugarcane crop in the year $1982–83$ is three times that of the year $1950–51$.