Question
Read the graph given in figure and answer the following question:
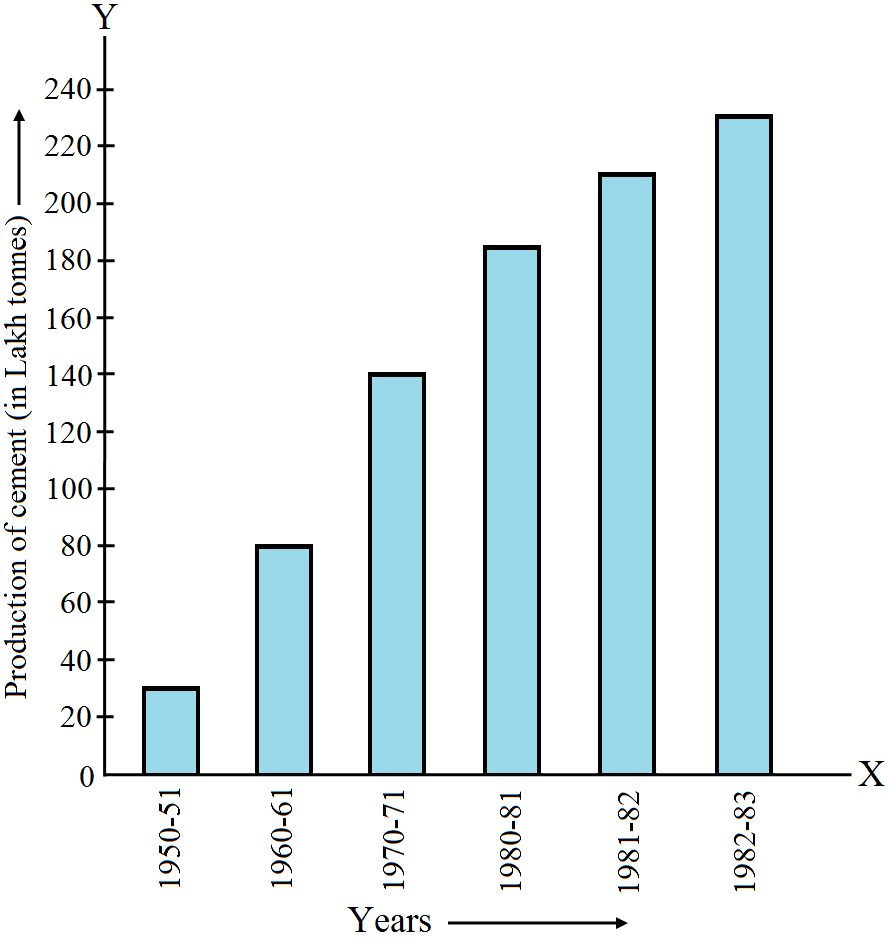
- What information is given by the bar given?
- In which years the areas under the sugarcane crop were the maximum and the minimum?
- State whether true or false: