Question
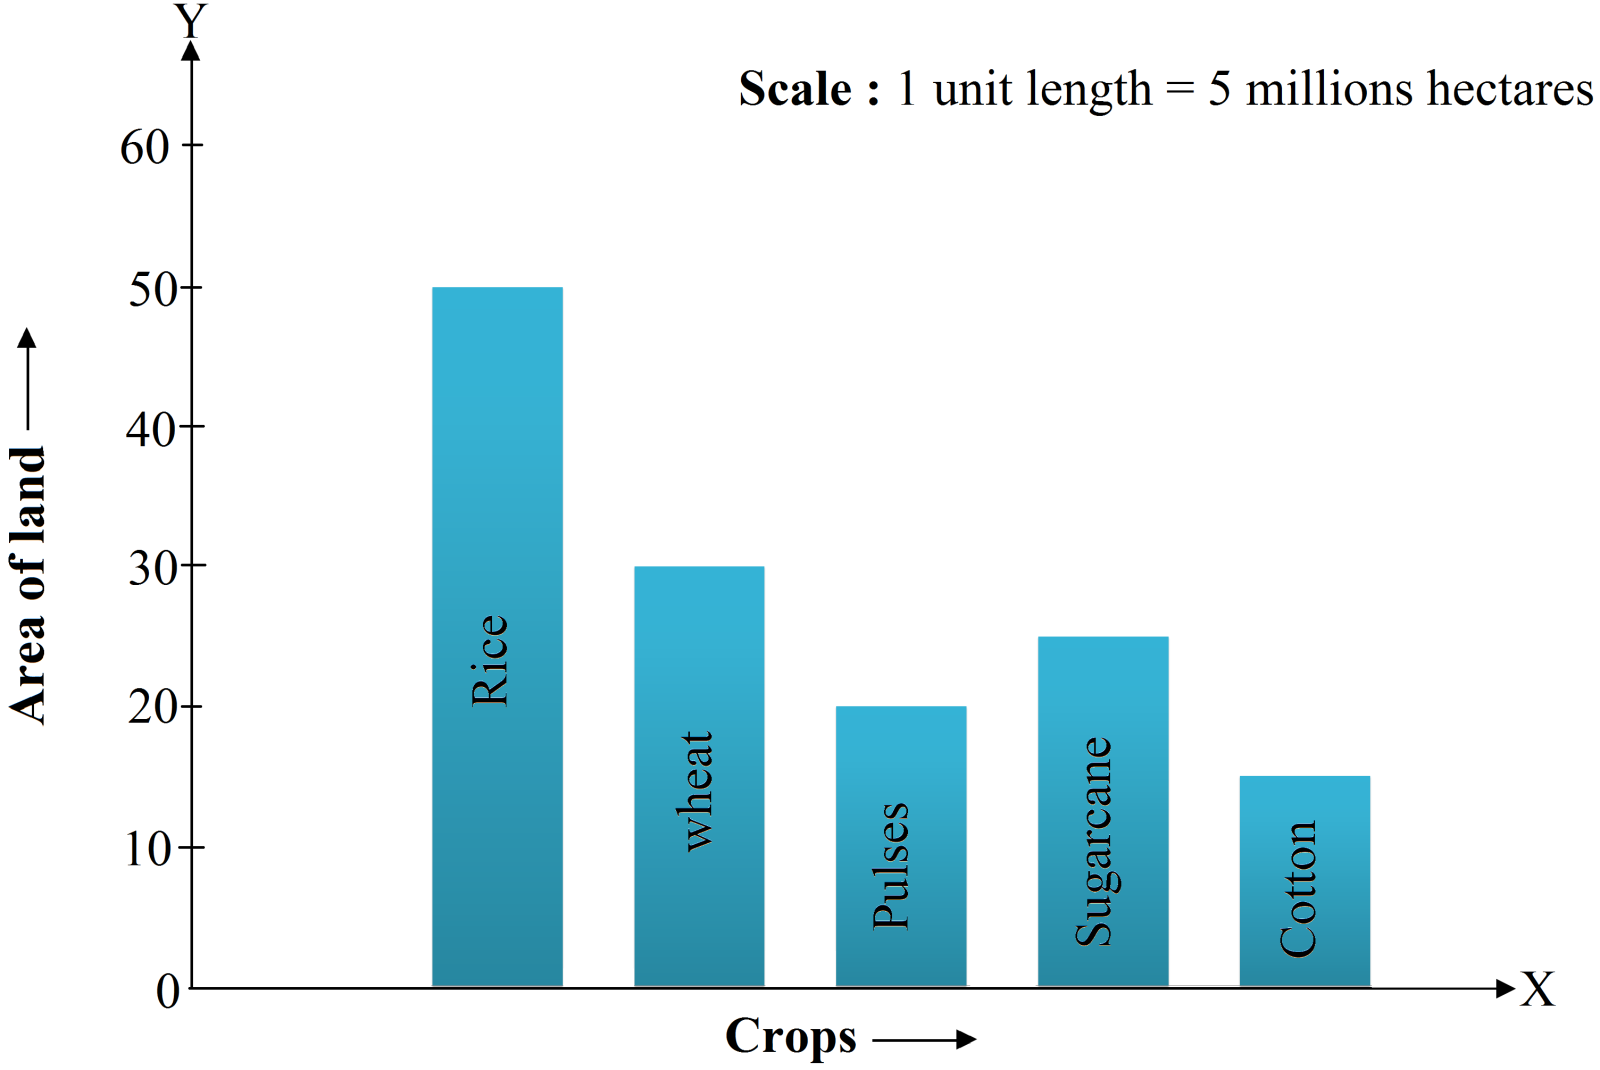
Refer to question $54.$ Prepare a bar graph of the data.

Answer

In order to construct a bar graph representing above data, we follow the following steps:
Step I: Take a graph paper and draw two mutually perpendicular lines $OX$ and $OY.$ Let $OX$ as the horizontal axis and $OY$ as the vertical axis.
Step II: Along $OX,$ mark crop and along $OY,$ mark area of the land.
Step III: Along $OX,$ choose the uniform (equal) width of the bars and the uniform gap between them, according to the space available for the graph.
Step IV: Choose a suitable scale to determine the heights of the bars, according to the availability of space. Flere, we choose $1$ unit length to represents $5$ million hectares.
Step V: Calculate the heights of various bars as follows:
Crop Height of bars
Rice $\frac{50}{5}=10\text{ units}$
Wheat $\frac{30}{5}=6\text{ units}$
Pulses $\frac{20}{5}=4\text{ units}$
Sugarcane $\frac{25}{5}=5\text{ units}$
Cotton $\frac{15}{2}=3\text{ units}$
Hence, the required bar graph of the given data is shown below:

Need a full question paper?

Generate a complete, print-ready paper with questions like this in minutes — across 16+ boards, with answer keys.

Start Generating Free

Similar questions

Out of $30$ students in a class, $6$ like football, $12$ like cricket and remaining like tennis. Find the ratio of number of students liking football to number of students liking tennis.
In Fig., what is the ratio of the areas of:
$a.\ $Shaded portion $I$ to shaded portion $II?$
$b.\ $Shaded portion $II$ to shaded portion $III?$
$c.\ $Shaded portions $I$ and $II$ taken together and shaded portion $III?$
Fill in the following blanks: $\frac{15}{18}=\frac{\square}{6}=\frac{10}{\square}=\frac{\square}{30}$ [Are these equivalent ratios?]
Write the fractions and match fractions in Column $ I$ with the aquivalent fractions in Column $II.$
There are $20$ girls and $15$ boys in a class. What is the ratio of a number of girls to the number of boys$?$
The following table shows the daily production of T.V.sets in an industry for 7 days week:
DayMonTueWedThursFriSatSum
Number of T.V. sets300400150250100350200
Represent the above information by a pictograph.
Following figures relate the weekly wages $($in $Rs.)$ of $15$ workers in a factory: $300, 250, 200, 250, 200, 150, 350, 200, 250, 200, 150, 300, 150, 200, 250$ Prepare a frequency table
$i.\ $What is the range in wages $($in $Rs.)$?
$ii.\ $How many Workers are getting $Rs. 350$?
$iii.\ $How many of workers are getting the minimum wages?
Study the bar graph representing the number of persons in various age groups in a town shown in Fig. Observe the bar grouph and answer the following questions:
$i.\ $What is the information given by the bar graph?
$ii.\ $What was the number of commercial banks in $1977$?
$iii.\ $What is the ratio of the number of commercial bank in $1969$ to that in $1980$?
$iv.\ $State whether true or false:
The number of commercial banks in $1983$ in less than double the number of commercial banks in $1969.$
Bar group of the number of commercial banks in india during some years
Find the perimeter of each of the following shapes:
Image
Draw five triangles and measure their sides. Check in each case, if the sum of the lengths of any two sides is always less than the third side.