Gujarat BoardEnglish MediumSTD 8MATHSIntroduction to Graphs1 Mark
MCQ
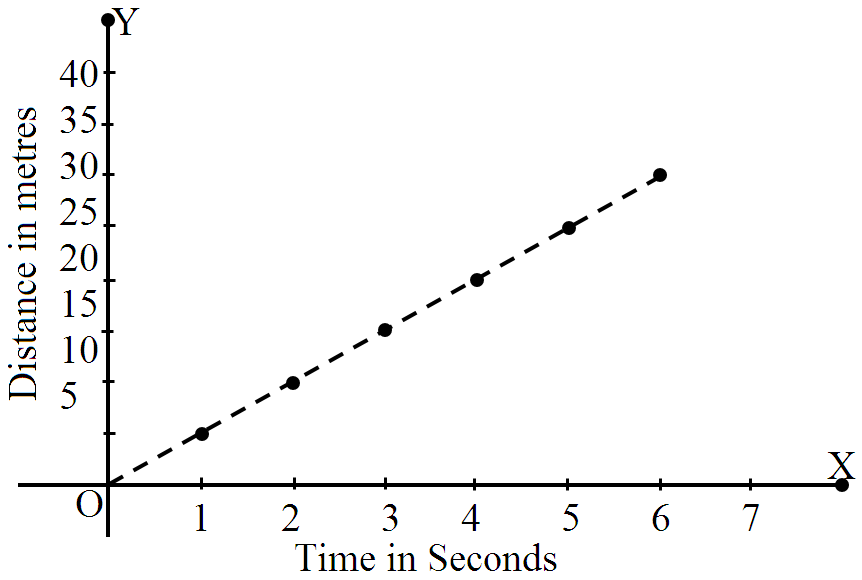
$..........$ represents data that changes continuously over period of time.
✓
Line graph
B
Pie graph
C
Bar graph
D
Histogram
✓
Answer
Correct option: A.
Line graph
The line graphs shows a change in data over time. A line graph is useful for displaying data or information that changes continuously over time. Another name for a line graph is a line chart.
Need a full question paper?
Generate a complete, print-ready paper with questions like this in minutes — across 16+ boards, with answer keys.