Question
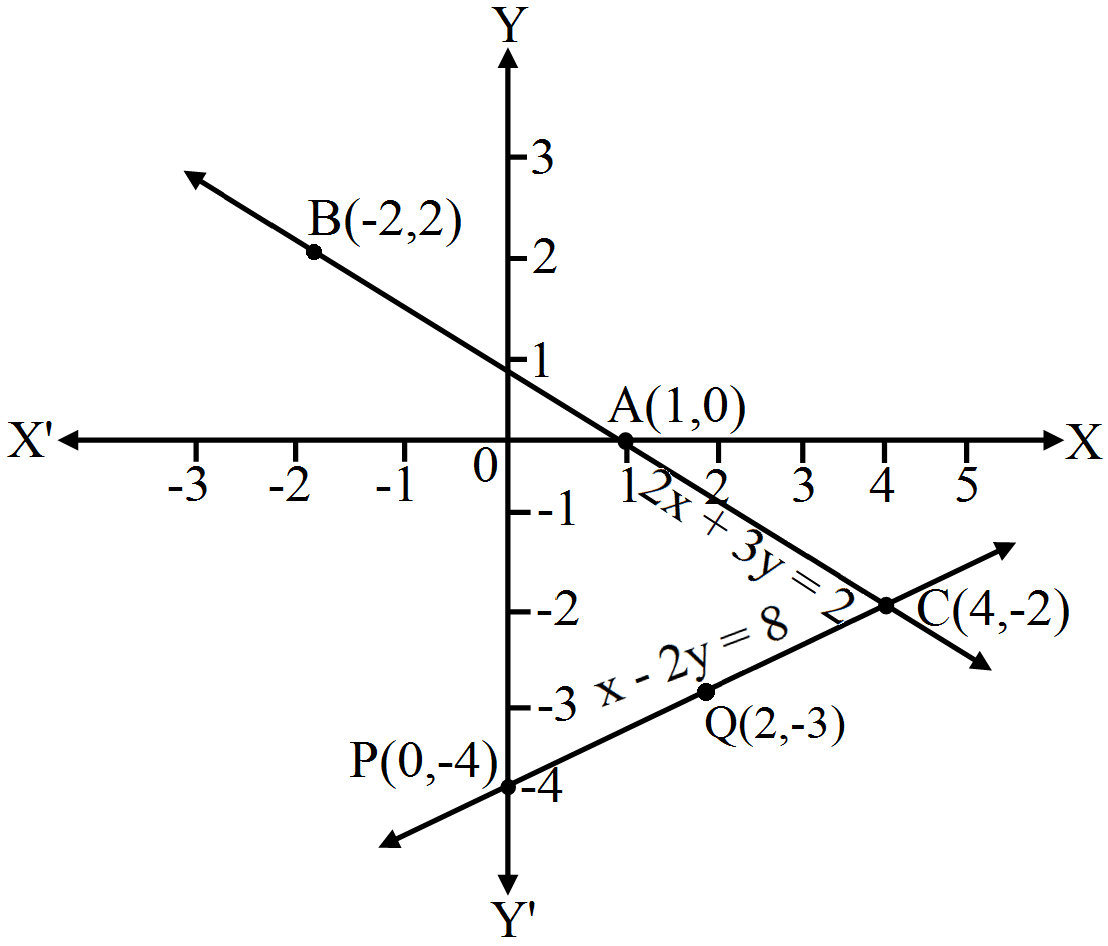
Solve the following system of equations graphically:
2x + 3y = 2,
x - 2y = 8

Answer

On a graph paper, draw a horizontal line X'OX and a vertical line YOY' representing the x-axis and y-axis, respectively.
Graph of 2x + 3y = 2:
$\text{y}=\frac{2(1-\text{x})}{3}$
Putting x = 1, we get y = 0
Putting x = -2, we get y = 2
Putting x = 4, we get y = -2
$\therefore$ Table for 2x + 3y = 2 is
x:
1
-2
4
y:
0
2
-2
Plot the points A(1, 0), B(-2, 2) and C(4, -2) on the graph paper.
Join AB and AC to get the graph line BC.
Extend it on both ways.
Thus, the line BC is the graph of x + 3y = 2.
Graph of x - 2y = 8:
$\text{y}=\frac{\text{x}-8}{2}$
Putting x = 2, we get y = -3
Putting x = 4, we get y = -2
Putting x = 0, we get y = -4
Table for x - 2y = 8 is
x:
2
4
0
y:
-3
-2
-4
Now, on the same graph paper plot the points P(0, -4) and Q(2, -3). The point C(4, -2) has already been plotted.
Join PQ and QC and extend it on both ways.
Thus, line PC is the graph of x - 2y = 8.

The two graph lines intersect at C(4, -2).
$\therefore$ x = 4, y = -2 is the solution of the given system of equations.

Need a full question paper?

Generate a complete, print-ready paper with questions like this in minutes — across 16+ boards, with answer keys.

Start Generating Free

Similar questions

Prove that $\frac{\sin\text{A}-2\sin^3\text{A}}{\big(2\cos^2\text{A}-\cos\text{A}\big)}=\tan\text{A}.$
Solve the following quadratic equation:
$\frac{1}{\text{2a}+\text{b}+\text{2x}}=\frac{1}{\text{2a}}+\frac{1}{\text{b}}+\frac{1}{\text{2x}}$
Show graphically that each of the following given systems of equations is inconsistent, i.e., has no solutions:
x - 2y = 6, 3x - 6y = 0
Draw a circle of radius 3.5cm. Take two point A and B on one of its extended diameter, each at a distance of 5cm from its centre. Draw tangents to the circle from each of these points A and B.
Each of the equal sides of an isosceles triangle measures 2cm more than its height, and the base of the triangle measures 12cm. Find the area of the triangle.
If the mean of the following frequency distribution is 54, find the value of p.
Class
0-20
20-40
40-60
60-80
80-100
Frequency
7
p
10
9
13
Solve each of the following given systems of equations graphically and find the vertices and area of the triangle formed by these lines and the x-axis:
x - 2y + 2 = 0, 2x + y - 6 = 0
Solve each of the following given systems of equations graphically and find the vertices and area of the triangle formed by these lines and the y-axis:
2x - 3y + 6 = 0, 2x + 3y - 18 = 0
Solve the following quadratic equation:
$\frac{1}{\text{x}-2}+\frac{2}{\text{x}-1}=\frac{6}{\text{x}}$ $\text{x}\neq0,\ 1,\ 2$
The frequency distribution table of more than type is as follows:
Production yield (kg/ha) (lower class limits) Cumulative frequency (cf)
More than 50 2 + 98 = 100
More than 55 8 + 90 = 98
More than 60 12 + 78 = 90
More than 65 24 + 54 = 78
More than 70 38 + 16 = 54
More than 75 16
Taking the lower class limits on x-axis and their respective cumulative frequencies on y-axis, its ogive can be obtained as follows: