MCQ
Statement-1 (A): The graphical representation of the frequency distribution
is as given in Fig.
Statement-2 (R): In a histogram, the areas of the rectangles are proportional to the frequencies.
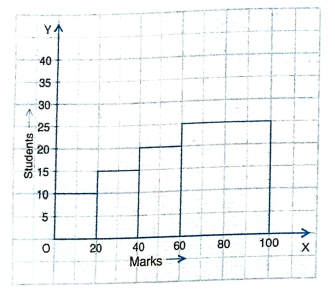
| Marks: | 0 - 20 | 20 - 40 | 40 - 60 | 60 - 100 |
| Number of students: | 10 | 15 | 20 | 25 |
Statement-2 (R): In a histogram, the areas of the rectangles are proportional to the frequencies.
- AStatement-1 and Statement-2 are True; Statement-2 is a correct explanation for Statement-1
- BStatement-1 and Statement-2 are True; Statement-2 is not a correct explanation for Statement-1
- ✓Statement-1 is True, Statement-2 is False.
- DStatement-1 is False, Statement-2 is True.