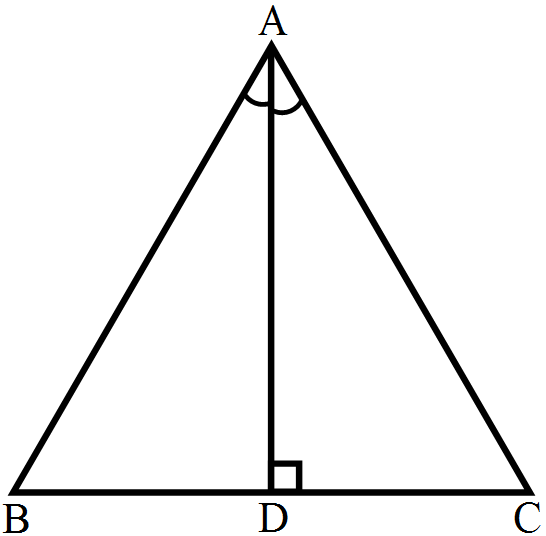
Question
Study the double bar graph given below and answer the questions that follow:
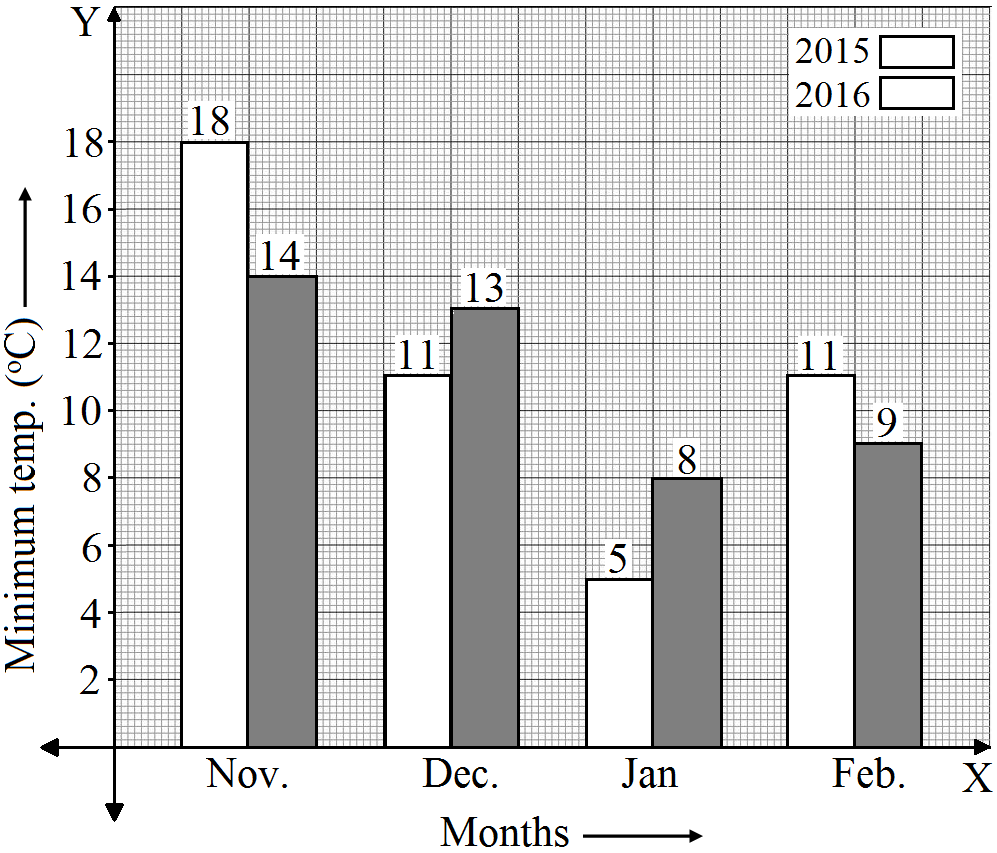
  1. What has been compared in the given double bar graph?
  2. What is the ratio of minimum temperatures in the year 2015 to the year 2016 in the month of November?
  3. Name the months in which the minimum temperature in 2015 was greater than that in 2016?
  4. Find the average minimum temperature for the year 2016 for the given four months.
  5. In which month is the variation in two temperatures maximum?

Answer

  1. Minimum temperature for the monts of Nov, Dec, Jan and Feb of 2015 and 2016 have been compared.
  2. Ratio of minimum temperature in 2015 to minimum temperature in 2016 during the month of Nov. $=\frac{18}{14}=\frac{9}{7}$
$\Rightarrow\text{Ratio}=9:7$
  1. In November and February the minimum temperature in 2015 was greater than that of 2016.
  2. Average minimum temperature for the year 2016 $=\frac{14+13+8+9}{4}=\frac{44}{4}=11^\circ\text{C}$
  3. November variation = 18 - 14 = 4
December variation = 13 - 11 = 2
January variation = 8 - 5 = 3
February variation = 11 - 9 = 2
During November the variation in two temperatures is maximum.

Need a full question paper?

Generate a complete, print-ready paper with questions like this in minutes — across 16+ boards, with answer keys.

Start Generating Free

Similar questions

Find the value of p, if the mean of the following distribution is 20
x:
15
17
19
20 + p
23
f:
2
3
4
5 p
6
The following table shows the market position of different brands of soaps. Draw a bar graph to represent this data.
Brand
A
B
C
D
Other
Percentage of buyers
45
25
15
10
5
The following table shows the weight of 12 players:
Weight (in kg) 48 50 52 54 58
Number of players 4 3 2 2 1
Find the median and mean weights.
Using empirical formula, calculate its mode.
The following table gives the route length (in thousand kilometres) of the Indian Railways in some of the years:
Year
1960-61
1970-71
1980-81
1990-91
2000-2001
Route length (in thousand kilometers)
56
60
61
74
98
Represent the above data with the help of a bar graph.
Arrange the following fractions in ascending order:
$\frac{4}{6},\frac{3}{8},\frac{6}{12},\frac{5}{16}$
A rectangular hall is 12 m long and 6 m broad. Its flooring is to be made of square tiles of side 30 cm. How many tiles will fit in the entire hall? How many would be required if tiles of side 15 cm were used ?
In the adjoining figure, ABC is a triangle in which AD is the bisector of $\angle\text{A}.$ If $\text{AD}\bot\text{BC}$ show that $\triangle\text{ABC}$ is isosceles.
Reduce the fractions $\frac{348}{319}, \frac{221}{247}, \frac{437}{551}$ to the lowest terms.
Fill in the blanks in the table.

Principal
Rate of interest (p.c.p.a.)TimeInterestAmount
i.Rs 42007%3 years
ii. 6%4 yearsRs 1200
iii.Rs 80005% Rs 800
iv. 5% Rs 6000Rs 18000
v. 2.5%5 yearsRs 2400
The birth rate per thousand in five countries over a period of time is shown below:
Country China India Germany UK Sweden
Birth rate per thousand 42 35 14 28 21
Represent the above data by a bar graph.