Question
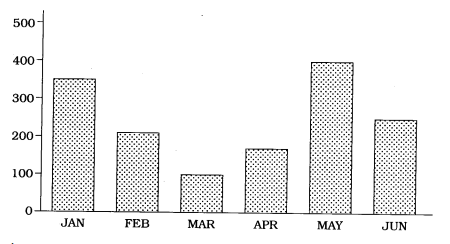
Study the following bar graph prepared from the data provided by class XA students about the months of their birth and write about six to seven sentences based on it:
Image

Answer

The maximum number of 6 students were born in August. The month that recorded the second-highest date of births was May. The lowest month for date of birth was June. Only one student was born in June. The same number of students, i.e. 4, were born in the months of February, October, November and December. Only two students each were born in the months of March, April and July. Three students each were born in the months of January and September.

Need a full question paper?

Generate a complete, print-ready paper with questions like this in minutes — across 16+ boards, with answer keys.

Start Generating Free

Similar questions

Study the following word-web and write the description in about six to seven sentences:
Image
A survey was conducted among the teachers of New Hope High School to find out whether Class X students should be allowed to use mobile phones in the campus. The results of the survey are shown in the ple-chart below. Write about six to seven sentences based on it :
Study carefully the following tree diagram about ‘Season in Maharashtra’. Write a short paragraph on the duration, work and the agricultural products available during the seasons in about 120 words:
The recent hike in bus fares prompted the artist to draw the following cartoon showing bus fares have become unaffordable.

Based on the cartoon above and using your own ideas write about six to seven sentences
Study the following chart and interpret it i six to seven sentences.150 N.C.C. Cadets of the school participating in 'Swachh Bharat Mission'
Image
Study the following bar graph showing the sale of Air conditioners by ‘Sales Gujarat’ from January to June in 2019 and write about six to seven sentences based on it:
Study the following table giving information about the features of different makes of cars and write about six to seven sentences comparing the features based on the table: