Question
Study the following table and answer the question.
Table A : Trade data for period 2009 – 10 to 2017 – 18
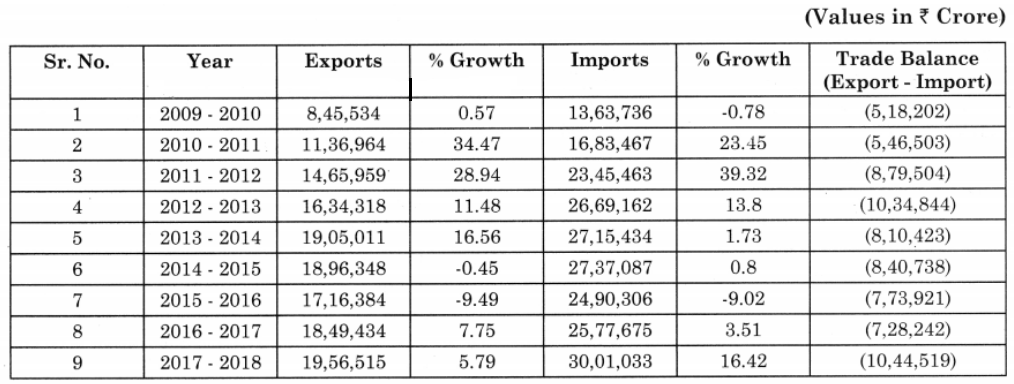
QU 1. In which year export growth was least and how much?
QU 2. In which year import growth was maximum and how much?
QU 3. During which year trade balance was minimum?
QU 4. Which concept of Balance of Trade is applicable here?
QU 5. How much was India’s export value in the year 2017-18?
QU 6. Give your opinion on India’s foreign trade.
Table A : Trade data for period 2009 – 10 to 2017 – 18
QU 1. In which year export growth was least and how much?
QU 2. In which year import growth was maximum and how much?
QU 3. During which year trade balance was minimum?
QU 4. Which concept of Balance of Trade is applicable here?
QU 5. How much was India’s export value in the year 2017-18?
QU 6. Give your opinion on India’s foreign trade.