Question
Study the graphical representation of Species richness - Area relationship given below and answer the questions that follow:
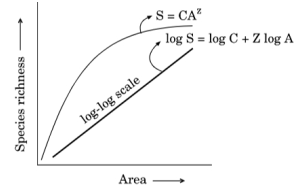
a. What do S, C, Z and A represent in the given graph?
b. What will be the range value of Z line if we analyse the species-area relationship among very large areas like entire continent?
a. What do S, C, Z and A represent in the given graph?
b. What will be the range value of Z line if we analyse the species-area relationship among very large areas like entire continent?