MCQ
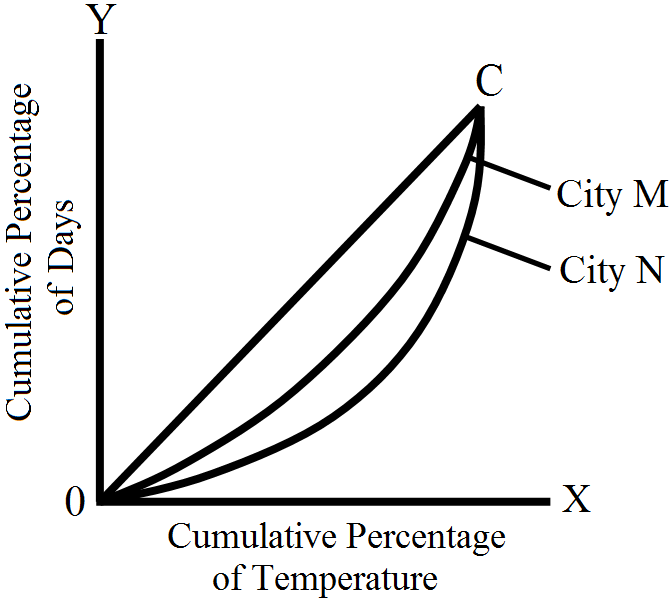
Study the Lorenz curve given below which depicts the maximum temperature of two cities, M and N in a month.
Which city exhibits greater variability in temperature?
Which city exhibits greater variability in temperature?
- ACity M
- ✓City N
- CNeither (a) nor (b)
- DBoth (a) and (b)