Question
Study the population growth curves in the graph given below and answer the questions which follow?

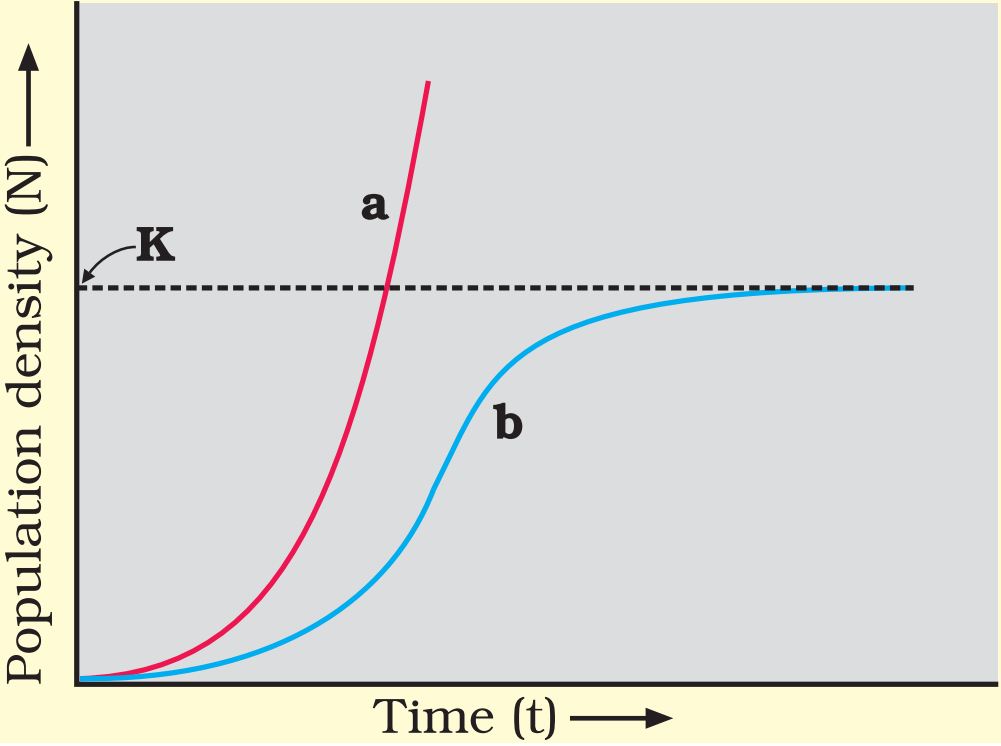
  1. Identify the growth curves 'a' and 'b'.
  2. Which one of them is considered a more realistic one and why?
  3. If $\frac{\text{dN}}{\text{dt}}=\text{r N}\Big(\frac{\text{K}-\text{N}}{\text{K}}\Big)$ is the equation of the logistic growth curve, what does K stand for?
  4. What is symbolised by N?

Answer

  1.  
  1. T-shaped, exponential growth curve.
  2. S-shaped logistic/ sigmoid growth curve
  1. curve b is more realistic because food for the animals is finite and so will soon become a limiting factor.
  2. 'K' is the carrying capacity of the area.
  3. 'N' is population density at time t.

Need a full question paper?

Generate a complete, print-ready paper with questions like this in minutes — across 16+ boards, with answer keys.

Start Generating Free