Question
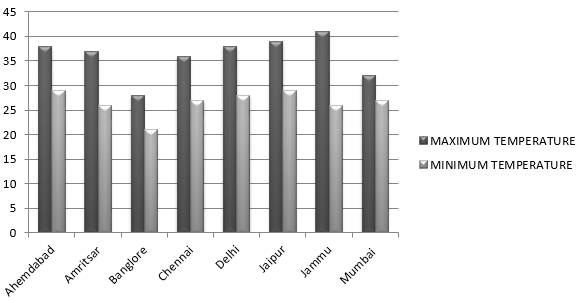
Take the data giving the minimum and the maximum temperature of various cities given in Table. Plot a double bar graph using the data and answer the question: Name two cities where maximum temperature of one was less than the minimum temperature of the other.
Temperatures of Cities as on $20.6.2006$
City Max. Min.
Ahmedabad $38^{\circ} \mathrm{C}$ $29^{\circ} \mathrm{C}$
Amritsar $37^{\circ} \mathrm{C}$ $26^{\circ} \mathrm{C}$
Banglore $28^{\circ} \mathrm{C}$ $21^{\circ} \mathrm{C}$
Chennai $36^{\circ} \mathrm{C}$ $27^{\circ} \mathrm{C}$
Delhi $38^{\circ} \mathrm{C}$ $28^{\circ} \mathrm{C}$
Jaipur $39^{\circ} \mathrm{C}$ $28^{\circ} \mathrm{C}$
Jammu $41^{\circ} \mathrm{C}$ $26^{\circ} \mathrm{C}$
Mumbai $32^{\circ} \mathrm{C}$ $27^{\circ} \mathrm{C}$

Answer


Here, we have to find the two cities where maximum temperature of one was less than the minimum temperature of the other.
From the graph, Bangalore has its maximum temperature as $28^\circ C.$
Whereas, The minimum temperature of the two cities Jaipur and Ahmedabad is $29^\circ C$
Hence, It can be concluded that the required pair of two cities are, Bangalore and Jaipur and Bangalore and Ahmedabad.

Need a full question paper?

Generate a complete, print-ready paper with questions like this in minutes — across 16+ boards, with answer keys.

Start Generating Free

Similar questions

State with reasons, which of the following pairs of terms are like terms and which are unlike terms:
$i. 7x, 12y$
$ii. 15x, –21x$
$iii. – 4\ ab, 7\ ba$
$iv. 3\ xy, 3x$
$v. 6\ xy^2 , 9\ x^2 y$
$vi. pq^2 , – 4\ pq^2$
$vii. mn^2 , 10\ mn$
In a "magic square", the sum of the numbers in each row, in each column and along the diagonal is the same. Is this a magic square?
$\frac{4}{11}$ $\frac{9}{11}$ $\frac{2}{11}$
$\frac{3}{11}$ $\frac{5}{11}$ $\frac{7}{11}$
$\frac{8}{11}$ $\frac{1}{11}$ $\frac{6}{11}$
Simplify $\frac{5^2 \times 3^3 \times(125)^{2 / 3}}{(27)^{2 / 3} \times(32)^{1 / 5}}$.
The following data gives the amount of loans (in crores of rupees) disbursed by a bank during some years:
Year19921993199419951996
Loan (in crores of rupees)2833555580
(i) Represent the above data with the help of a bar graph.
(ii) With the help of the bar graph, indicate the year in which amount of loan is not increased over that of the preceding year.
In the given figure, l || m and t is a transversal. If $\angle 1=55^{\circ}$, find $\angle 2, \angle 3, \angle 4, \angle 5, \angle 6, \angle 7$ and $\angle 8$.
Image
A room is 9 m long, 8 m broad and 6.5 m high. It has one door of dimensions $2 m \times 1.5 m$ and three windows each of dimensions $1.5 m \times 1 m$. Find the cost of white washing the walls at ₹ $ 3.80$ per square metre.
The longer side of a parallelogram is 54 cm and the corresponding altitude is 16 cm. If the alti-tude corresponding to the shorter side is 24 cm, find the length of the shorter side.
In Fig., the sides $B C, C A$ and $B A$ of a $\triangle A B C$ have been produced to $D, E$ and $F$ respectively. If $\angle A C D=105^{\circ}$ and $\angle E A F=45^{\circ}$; find all the angles of the $\triangle A B C$.
Image
A doctor reports blood pressure in millimetres of mercury $(mm \ Hg)$ as a ratio of systolic blood pressure to diastolic blood pressure $($such as $140$ over $80)$. Systolic pressure is measured when the heart beats and diastolic pressure is measured when it rests. Refer to the table of blood pressure ranges for adults.
    Blood Perssure Ranges  
  Normal Prehypertension Hypertension
Systolic Under $120\ mm \ Hg$ $120 - 139\ mm \ Hg$ $140\ mm \ Hg$ and above
Diatolic Under $80\ mm \ Hg$ $80 - 89\ mm \ Hg$ $90\ mm \ Hg$ and above
Manohar is a healthy $37$ year old man whose blood pressure is in the normal category.
$a.$ Calculate an approximate ratio of systolic to diastolic blood pressures in the normal range.
$b.$ If Manohar's systolic blood pressure is $102\ mm \ Hg,$ then use the ratio from part $(a)$ to predict his diastolic blood pressure.
$c.$ Calculate ratio of average systolic to average diastolic blood pressures in the prehypertension category.
Find the value of p for the following distribution whose mean is 16.6
x:81215p202530
f:121620241684