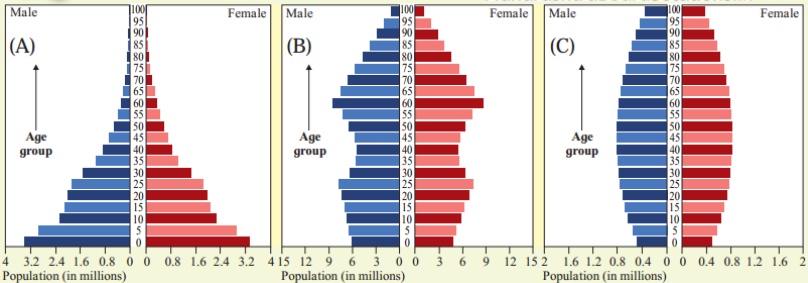
(1)In the above figure A, B, C are three population pyramids. Study their shapes and answer the following questions.
(i) In which pyramid(s) the number of children will be the least?
(ii) In which pyramid(s) the number of old people will be the least?
(iii) Which pyramid(s) represents a ‘young country’?
(iv) Which pyramid(s) represents a country with high medical expenditure?
(v) Which pyramid(s) represents a country with large manpower?
(vi) Which pyramid(s) represents developing and developed counties respectively?
(2)Answer the questions after studying table carefully.
| Country |
Retirement Age reforms being implemented or under consideration (in years) |
| Germany |
Retirement age to increase gradually to 66 by 2023 and to 67 by 2029 |
| United States of America |
Retirement age to rise gradually to reach 67 for those born in 1960 or later |
| United Kingdom |
Retirement age to increase for both men and women to 66 by October 2020 and further to 67 between 2026-28 |
| Australia |
Retirement age scheduled to increase gradually to 67 by 2023 |
| China |
By 2045, to increase retirement age for both men and women to 65 |
| Japan |
Under consideration to raise the retirement age to 70 |
| India |
On an average, 60 years. May vary from 55 years to 65 years according to services |
(i) What does the table show?
(ii) Classify these countries into developed and developing.
(iii) What could be the reason behind increasing the retirement age in these countries?
(iv) What will be the impact of increase in the retirement age on the economy of the respective countries?
(v) Why is China considering increasing the age later in 2045?
(vi) Considering these examples from developed countries, will it be good for India to increase its retirement age? Express your views.
(vii) Write a concluding statement about the relationship between age structure, life expectancy and economy of a country.
(3)You have already made a list of the reasons why migration occurs. Add more reasons to it. Discuss and classify these reasons into pull and push factors and complete the figure.
(4)Complete the following table which shows impact of migration on the population.
| Type of migration |
Positive effects |
Negative effects |
| Internal migration |
Employment is available to migrants. Improves their financial status. |
Resources are affected. Sometimes, they might be sent back to their original country. |
| Rural to urban migration |
– |
– |
| Urban to rural migration |
– |
– |
| Rural to rural |
– |
– |
| Seasonal / Temporary |
– |
– |