Question
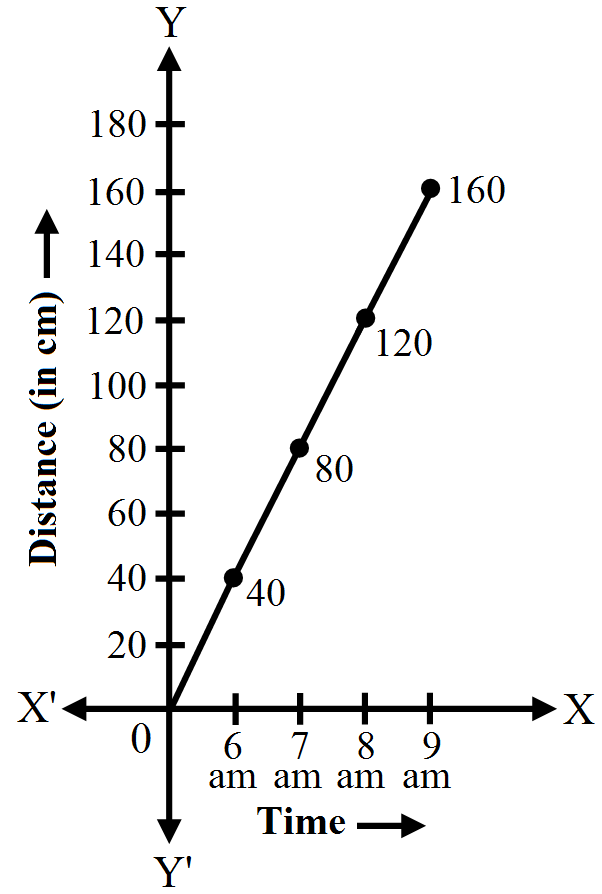
The following table gives the distances travelled by a car at various time-intervals. Study the table and draw a linear graph for the same.
From your graph, answer the questions given below:
|
Time
|
6 a.m.
|
7 a.m.
|
8 a.m.
|
9 a.m.
|
|
Distance (in km)
|
40
|
80
|
120
|
160
|
- How much distance did the car cover during the period from 7:30 a.m. to 8 a.m.
- What was the time when the car had covered a distance of 100km, since its start?
- How much distance had the car covered by 8:30 a.m.?