Question
The given graph shows the variation of p-V versus p graph for different gases at constant temperature. Which of the following gas is ideal and why? 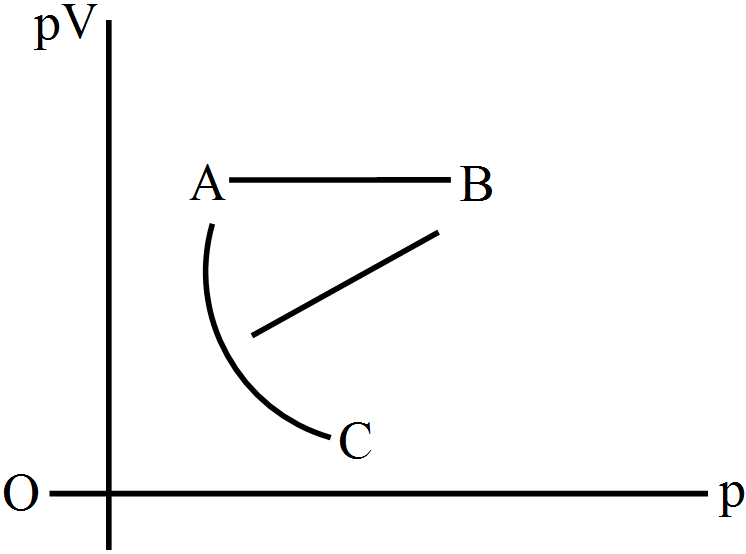
Generate a complete, print-ready paper with questions like this in minutes — across 16+ boards, with answer keys.