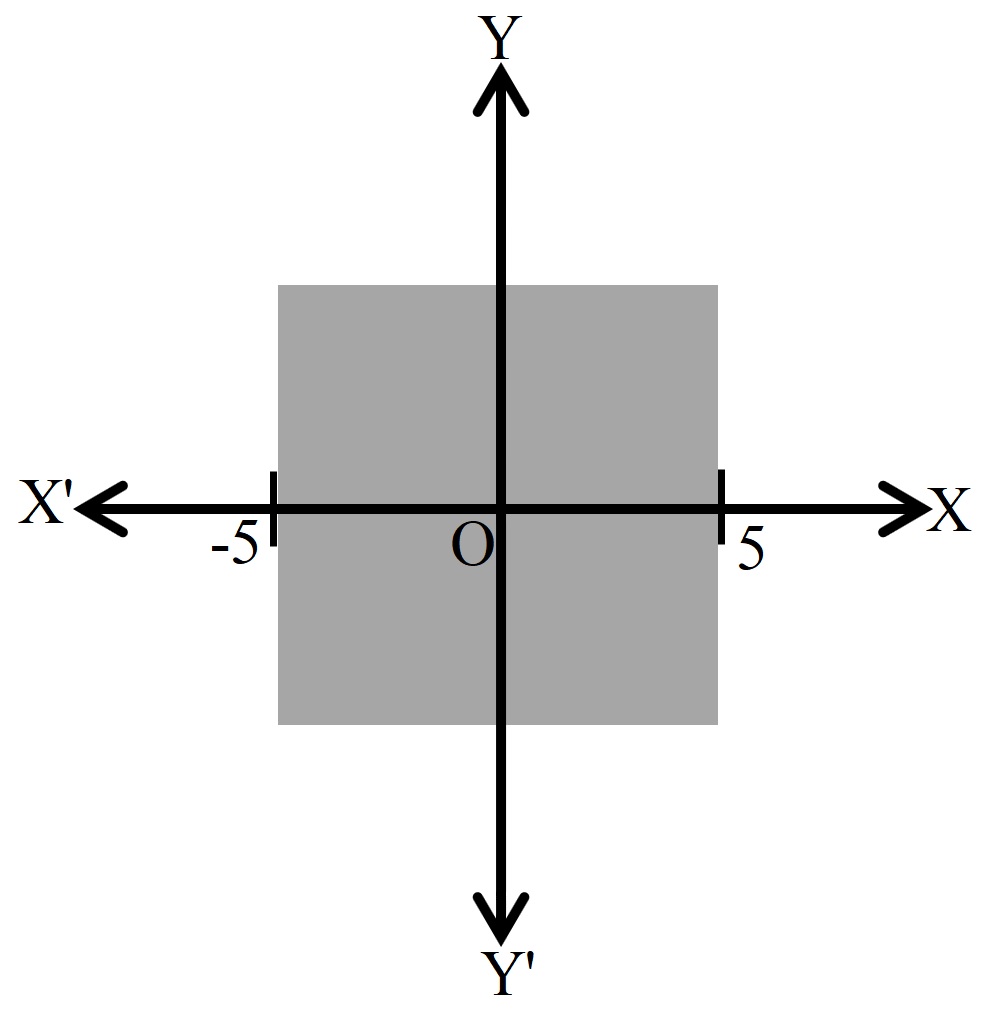
MCQ
The inequality representing the following graph is:
  • $|\text{x}|<5$
  • B
    $|\text{x}|\leq5$
  • C
    $|\text{x}|>5$
  • D
    $|\text{x}|\geq5$

Answer

Correct option: A.
$|\text{x}|<5$
  1. $|\text{x}|<5$

Need a full question paper?

Generate a complete, print-ready paper with questions like this in minutes — across 16+ boards, with answer keys.

Start Generating Free