Question
The population of Delhi State in different census years is as given below:
Census year
1961
1971
1981
1991
2001
Population in Lakhs
30
55
70
110
150
Represent the above information with the help of a bar graph.

Answer

While drawing a bar graph, we keep in mind that:
The width of the bars should be uniform throughout.
The gap between any two bars should be uniform throughout.
Bars may be either horizontal or vertical.
To represent the given data by a vertical bar graph, we first draw horizontal and vertical axes.
Let us consider that the horizontal and vertical axes represent the years and the population in lakhs respectively. We have to draw 5 bars of different heights given in the table. At first, we mark 5 points in the horizontal axis at equal distances and erect rectangles of the same width at these points. The heights of the rectangles are proportional to the population in lakhs. The vertical bar graph of the given data is following:

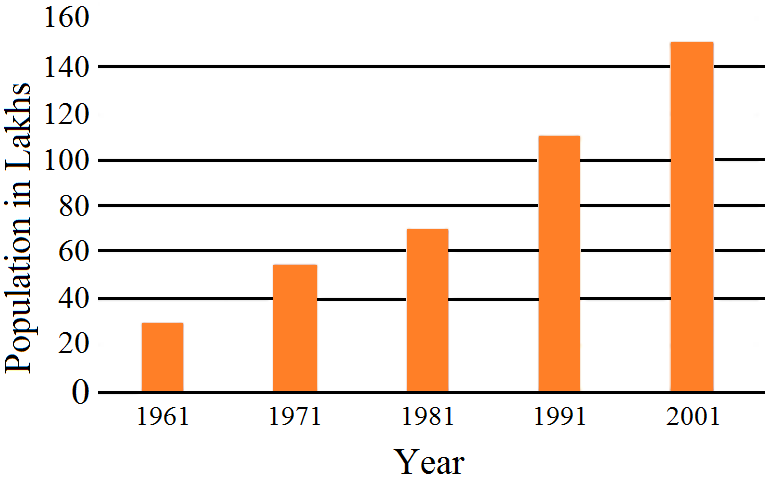
Note that each bar is of the same width and the gap between them is uniform. Make sure that the width of the bars and the gap between them should not be necessarily same.

Need a full question paper?

Generate a complete, print-ready paper with questions like this in minutes — across 16+ boards, with answer keys.

Start Generating Free

Similar questions

Two circles of radii 10cm and 8cm intersect each other, and the length of the common chord is 12cm. Find the distance between their centres.

The ages (in years) of 360 patients treated in a hospital on a particular day are given below:
Age in years
10-20
20-30
30-40
40-50
50-60
60-70
Number of patients
90
40
60
20
120
30
Draw a histogram and a frequency polygon on the same graph to represent the above data.
In each of the figures given below, ABCD is a rhombus. Find the value of x and y in each case.

A cloth having an area of 165m2 is shaped into the form of a conical tent of radius 5m. $\Big(\text{Use}\ \pi=\frac{22}{7}\Big).$
  1. How many students can sit in the tent if a student, on an average, occupies $\frac{5}{7}\text{m}^2$ on the ground?
  2. Find the volume of the cone.
In the given figure, POQ is a diameter and PQRS is a cyclic quadrilateral. If $\angle\text{PSR}=150^\circ,$ find $\angle\text{RPQ}.$

Simplify the following products:
$\Big(\frac{\text{x}}{2}-\frac{2}{5}\Big)\Big(\frac{2}{5}-\frac{\text{x}}{2}\Big)-\text{x}^2+2\text{x}$
Two lines AB and CD intersect at a point O, such that $\angle\text{BOC}+\angle\text{AOD}=280^\circ,$ as shown in the figure. Find all the four angles.

The investments (in ten crores of rupees) of Life Insurance Corporation of India in different sectors is given below:
Sectors
Investment (in ten crores of rupess)
Central government securities
45
State government securities
11
Securities guaranteed by the government
23
Private sectors
18
Socially oriented sectors (plan)
46
Socially oriented sectors (Non–plan)
11
Represent the above data with the help of a bar graph.
The image of an object placed at a point A before a plane mirror LM is seen at the point B by an observer at D, as shown in the figure. Prove that the image is as far behind the mirror as the object is in front of the mirror.

The expression (a - b)3 + (b - c)3 + (c - a)3 can be factorized as:
  1. (a - b)(b - c)(c - a)
  2. 3(a - b)(b - c)(c - a)
  3. -3(a - b)(b - c)(c - a)
  4. (a + b + c)(a2 + b2 + c2 - ab - bc - ca)