Question
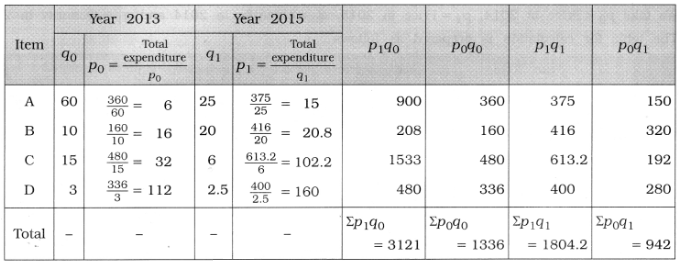
The quantity consumed and total expenditure of four different items are as given below. Find Paasche’s and Fisher’s index number for the year $2015$ with respect to the year $2013.$
Item Base year $2013$ Current year $2015$
  Total expenditure
(Rs.)
Consumption (Quantity) Total expenditure
(Rs.)
Consumption (Quantity)
$A$ $360$ $60 \ kg$ $375$ $25 \ kg$
$B$ $160$ $10$ litre $416$ $30$ litre
$C$ $480$ $15 \ kg$ $613.2$ $6 \ kg$
$D$ $336$ $3 \ kg$ $400$ $2.5 \ kg$

Answer

Here, quantity (consumption) of items and their total expenditure are given. We obtain the price per unit of item using the formula, Price per unit $=\frac{\text { Total expenditure }}{\text { Quantity }}$
We take $p_0=$ Price in $2013,$
$p_1 =$ Price in $2015,$
$q =$ Quantity in $2013$ and
$q_1=$ Quantity in $2015.$
 The table for calculation is prepared as follows :
Image
Paasche's index number:
$ I_p=\frac{\Sigma p_1 q_1}{\Sigma p_0 q_1}$
$=\frac{1804.2}{942}$
$=1.53$
Fisher's index number:
$\mathrm{I}_{\mathrm{F}}=\sqrt{\frac{\Sigma p_1 q_0}{\Sigma p_0 q_0} \times \frac{\Sigma p_1 q_1}{\Sigma p_0 q_1}} \times 100$
$=\sqrt{\frac{3121}{1336} \times \frac{1804.2}{942}} \times 100$
$=\sqrt{\frac{5630908.2}{1258512}} \times 100$
$=\sqrt{4.4742} \times 100$
$=2.1152 \times 100$
$=211.52$

Need a full question paper?

Generate a complete, print-ready paper with questions like this in minutes — across 16+ boards, with answer keys.

Start Generating Free

Similar questions

The following sample data is obtained to study the relation between the number of customers visiting a mall per day and the sales $($ten thousand $₹) :$
Image
Obtain the regression line of $Y$ on $X.$ Estimate the sales of a mall if $80$ customers have visited the mall on a particular day.
The mean of a binomial distribution is three times its variance. If the sum of its mean and variance is $8,$ find the parameters of the distribution.
Compute the general index number for the production using the following data:
From the following data of price (in ₹) and demand (in hundred units) of a commodity, obtain the regression line of demand on price. Also estimate the demand when price is ₹ 60 :
Price (in ₹) x364245485463
Demand (hundred units) y543630242115
The information collected regarding price (in ₹) of a commodity and its supply (in hundred units) is as follows:

Obtain the regression line of the supply on the price.
In order to study the relationship between the repairing time of accident damaged cars and the cost of repair, the following information is collected.
Obtain the regression line of $Y ($repairing cost$)$ on $X ($repairing time$).$ If the time taken to repair a car is $50$ hours, find an estimate of the repairing cost.
If $y=\frac{x^{3}}{3}+\frac{x^{2}}{2}-2 x+2$ for what values of $x, y$ will be maximum or minimum?
If $Z$ is standard normal variable and $z_{1}$ is $Z$-score then obtain the values of $z_{1}$ satisfying the following conditions
$(1) P\left(-1 \leq Z \leq z_{1}\right)=0.5255$
$(2) P\left(z_{1} \leq Z \leq 2\right)=0.7585$
The details of monthly sale of Laptop $($in thousand units$)$ and its profit $($in lakh$)$ for the last six months for a company making laptops are given below.
No. of laptops sold $($thousand units $x )$ $3$ $8$ $12$ $5$ $7$ $5$
Profit $($lakh $₹) y$ $6$ $10$ $15$ $10$ $9$ $8$
Find the correlation coefficient between "number of laptops sold' and its 'profit".
To know the relationship between the heights of father and sons, obtain the regression line of height of son on the height of father from the following information of eight pairs of fathers and adult sons.

Estimate the height of a son whose father’s height is $170\ cm$.