MCQ
The v-t graph below represents
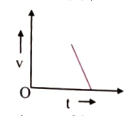
- Aconstant positive acceleration.
- Bzero acceleration.
- Cconstant positive acceleration with non-zero initial velocity.
- ✓constant negative acceleration.
Generate a complete, print-ready paper with questions like this in minutes — across 16+ boards, with answer keys.