Question
Three speed-time graphs are given below:
Which graph represents the case of:
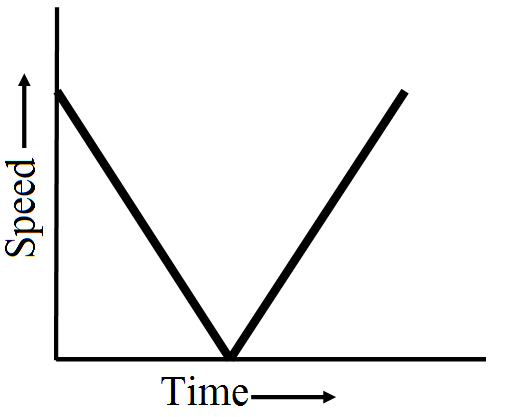
- A cricket ball thrown vertically upwards and returning to the hands of the thrower?
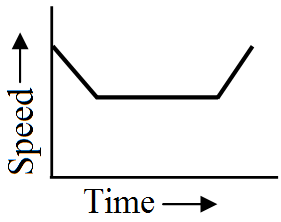
- A trolley decelerating to a constant speed and then accelerating uniformly?
Generate a complete, print-ready paper with questions like this in minutes — across 16+ boards, with answer keys.