MCQ
Two students were asked to plot a distance-time graph for the motion described by Table $A$ and Table $B.$
Table A
Table B
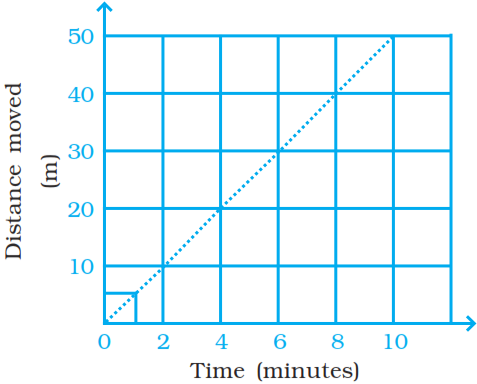
The graph given in Figure is true for:
Table A
|
Distance moved (m)
|
$0$
|
$10$
|
$20$
|
$30$
|
$40$
|
$50$
|
|
Time (minutes)
|
$0$
|
$2$
|
$4$
|
$6$
|
$8$
|
$10$
|
|
Distance moved (m)
|
$0$
|
$5$
|
$10$
|
$15$
|
$20$
|
$25$
|
|
Time (minutes)
|
$0$
|
$1$
|
$2$
|
$3$
|
$4$
|
$5$
|
The graph given in Figure is true for:
- ✓Both $A$ and $B.$
- B$A$ only.
- C$B$ only.
- DNeither $A$ nor $B.$