Question
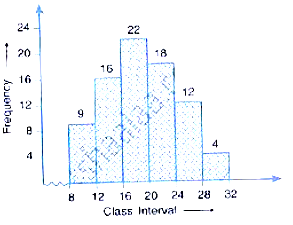
Use the information given in the adjoining histogram to construct a frequency table.
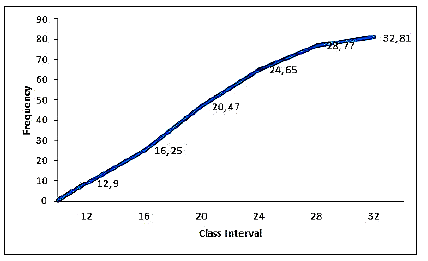
Use this table to construct an ogive.
Use this table to construct an ogive.
| Class Interval | Frequency | c.f. |
| 8-12 | 9 | 9 |
| 12-16 | 16 | 25 |
| 16-20 | 22 | 47 |
| 20-24 | 18 | 65 |
| 24-28 | 12 | 77 |
| 28-32 | 4 | 81 |
Generate a complete, print-ready paper with questions like this in minutes — across 16+ boards, with answer keys.
| x : | 1 | 2 | 3 | 4 | 5 | 6 | 7 | 8 | 9 |
| f : | 8 | 10 | 11 | 16 | 20 | 25 | 15 | 9 | 6 |