Question
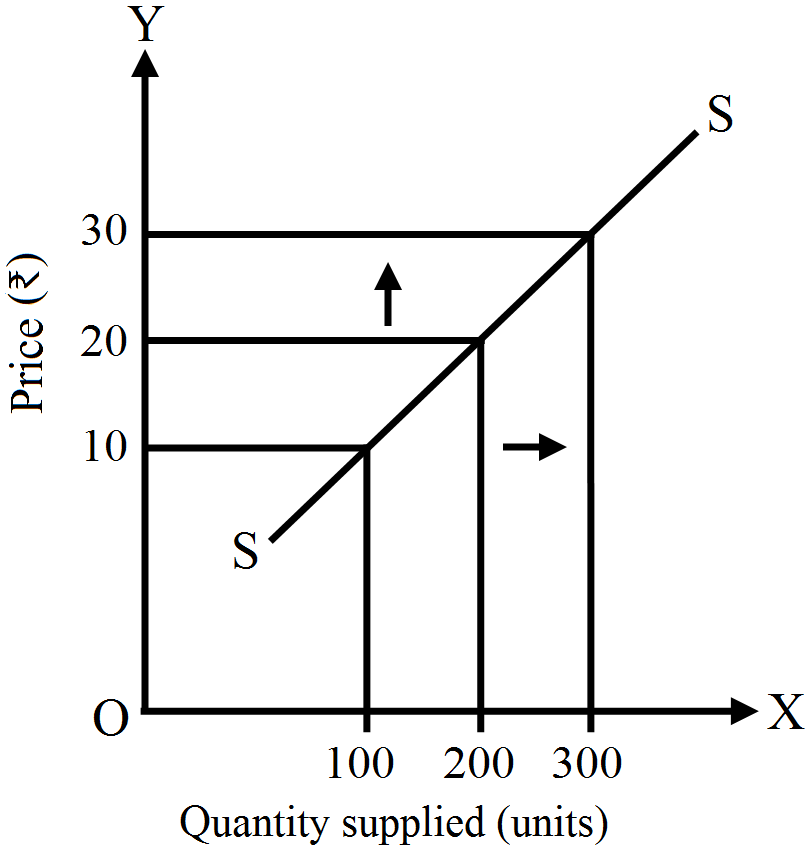
Using diagram and schedule, explain the Law of Supply

Answer

The Law of Supply states that other things being equal, quantity supplied increases with the increase in price and decreases with the decrease in price of a commodity.

It can be explained with the help of following schedule and diagram:

S. No.
Price ()
Quantity supplied (units)
i.
10
100
ii.
20
200
iii.
30
300
The supply schedule shows the positive relationship between price and quantity supplied. This is in accordance with the Law of Supply.

SS is the supply curve sloping upward. It shows a positive relationship between price and quantity supplied of a commodity. When price increases from ₹ 10 to ₹ 20, quantity supplied increases from 100 to 200 units.

Need a full question paper?

Generate a complete, print-ready paper with questions like this in minutes — across 16+ boards, with answer keys.

Start Generating Free

Similar questions

Explain the implication of the following: The feature of ‘no close substitutes' under monopoly.
Producer can sell more of a good only by lowering price. Prepare Total Revenue and Marginal Revenue schedule. Take four output levels.
Make a graphical representation of the following table -
(Units)(Total Utility)(Marginal Utility)
11212
2186
3224
4242
5240
622-2
From the following data, calculate Personal Income and Personal Disposable Income:
    Rs. (crore)
(a) Net Domestic Product at factor cost 8,000
(b) Net Factor Income from abroad 200
(c) Undisbursed Profit 1,000
(d) Corporate Tax 500
(e) Interest Received by Households 1,500
(f) Interest Paid by Households 1,200
(g) Transfer Income 300
(h) Personal Tax 500
Define Average Revenue. Show that Average Revenue, and Price are same.
Define indifference curve. Explain the three properties of indifference curves.

OR

Explain the three properties of indifference curve.

OR

Explain the three properties of indifference curve.

OR

State and explain three properties of indifference curves.

Explain why the tax multiplier is smaller in absolute value than the government expenditure multiplier.
Explain the components of Legal Reserve Ratio.
A firm fixed average cost of producing 2 units of a good is Rs.9 and its total cost schedule is given below. Calculate average variable cost and marginal cost for each of given level of output.
Output (Units)
1
2
3
Total Cost (₹)
23
27
30
Calculate “sales” from the following data:

  (Rs. in Lakhs)
  1. Net  value added at factor cost

560

  1. Depreciation

60

  1. Change in stock

(-) 30

  1. Intermediate cost

1000

  1. Exports

200

  1. indirect taxes

60