Question
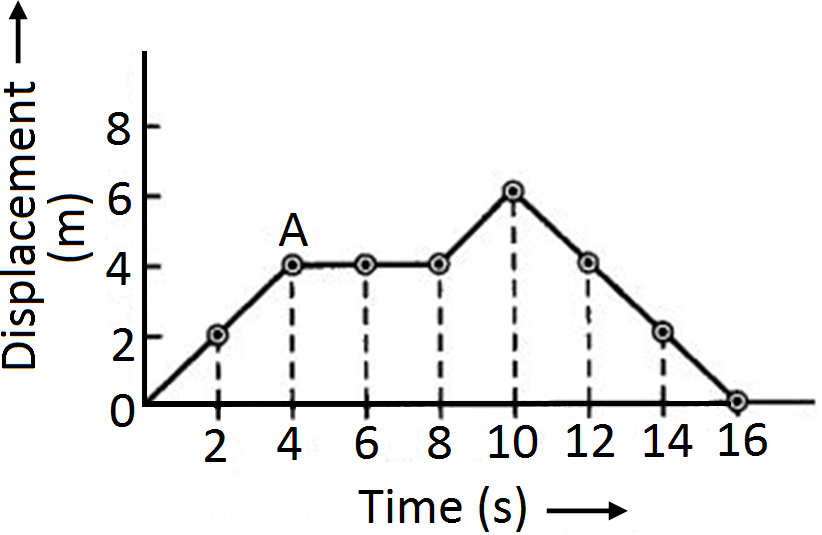
Using following data, draw time-displacement graph for a moving object:
Time $(s)$
$0$
$2$
$4$
$6$
$8$
$10$
$12$
$14$
$16$
Displacement $(m)$
$0$
$2$
$4$
$4$
$4$
$6$
$4$
$2$
$0$
Use this graph to find average velocity for first $4s,$ for next $4s$ and for last $6s.$

Answer

Therefore, displacement-time graph is shown in figure.

Average velocity for first $4\text{s}=\frac{\text{Change in displacement}}{\text{Total time takan}}$
$\text{v}=\frac{4-0}{4-0}=\frac{4\text{m}}{4\text{s}}=1\text{ms}^{-1}$
Average velocity for next $4s ($i.e., in the interval of $4s$ to $8s),$
$\text{v}=\frac{4-4}{8-4}=\frac{0}{4}=0$
Average velocity for last $6\text{s}=\frac{(0-6)\text{m}}{(16-10)\text{s}}=\Big(\frac{-6}{6}\Big)=1\text{ms}^{-1}$

Need a full question paper?

Generate a complete, print-ready paper with questions like this in minutes — across 16+ boards, with answer keys.

Start Generating Free