Question
Using the information given in the adjoining histogram, calculate the mean.
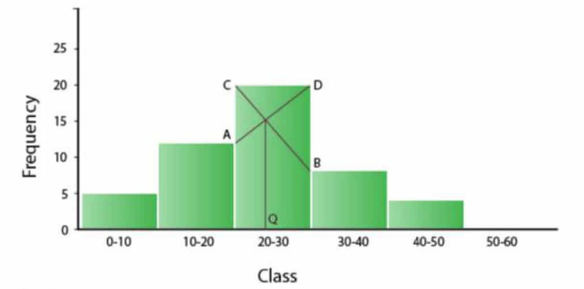
| C.I | Frequency | Mid value x | Fx |
| 15-25 | 10-Jan | 20 | 200 |
| 25-35 | 20 | 30 | 600 |
| 35-45 | 25 | 40 | 1000 |
| 45-55 | 15 | 50 | 750 |
| 55-65 | 5 | 60 | 300 |
| Total | 75 | 2850 |
Generate a complete, print-ready paper with questions like this in minutes — across 16+ boards, with answer keys.