Question
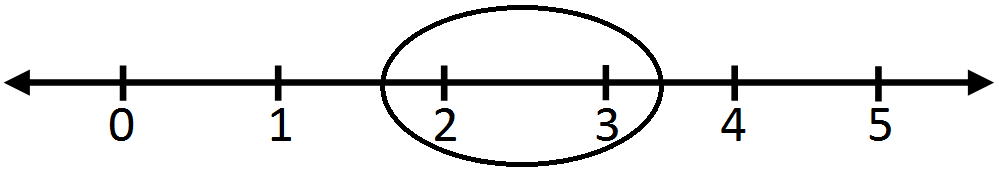
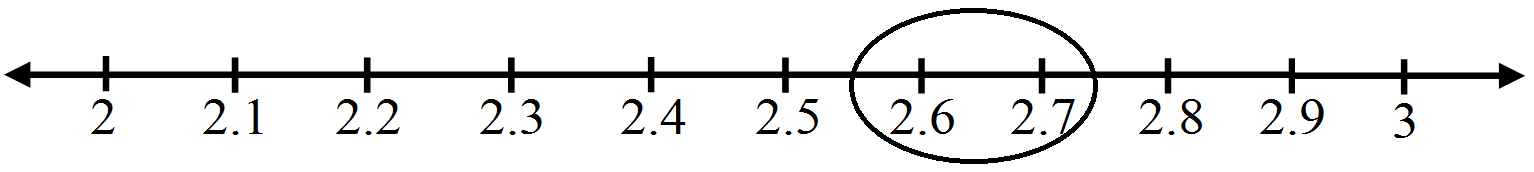
Visualise $2.665$ on the number line, using successive magnification.

Answer

The following steps for successive magnification to visualise $2.665$ are:
$1.$ We observe that $2.665$ is located somewhere between $2$ and $3$ on the number line.
So, let us look at the portion of the number line between $2$ and $3$.

$2.$ We divide this portion onto $10$ equal parts and mark each point of division.
The first mark to the right of $2$ will represent $2.1$, the next $2.2$ and soon.
Again we observe that $2.665$ lies between $2.6$ and $2.7.$

$3.$ We mark these points $A_1$ and $A_2$ respectively.
The first mark on the right side of $A,$ will represent $2.61$, the number $2.62$, and soon.
We observe $2.665$ lies between $2.66 $and $2.67.$

$4.$ Let us mark $2.66$ as $B _1$ and $2.67$ as $B _2$. Again divide the $B _1 B_2$ into ten equal parts. The first mark on the right side of $B_1$ will represent $2.661$ , then next $2.662$ , and so on.

Clearly, fifth point will represent $2.665.$

Need a full question paper?

Generate a complete, print-ready paper with questions like this in minutes — across 16+ boards, with answer keys.

Start Generating Free

Similar questions

Prove that the angle in a segment shorter than a semicircle is greater than a right angle.
It is required to make a closed cylindrical tank of height $1\ m$ and the base diameter of $140\ cm$ from a metal sheet. How many square meters of the sheet are required for the same?
If each side of a triangle is doubled, the find percentage increase in its area.
If an angle of a parallelogram is two-third of its adjacent angle, find the angles of the parallelogram.
The time taken, in seconds, to solve a problem by each of $25$ pupils is as follows:
$16, 20, 26, 27, 28, 30, 33, 37, 38, 40, 42, 43, 46, 46, 46, 48, 49, 50, 53, 58, 59, 60, 64, 52, 20$.
$a.$ Construct a frequency distribution for these data, using a class interval of $10$ seconds.
$b.$ Draw a histogram to represent the frequency distribution.
Thirty children were asked about the number of hours they watched $TV$ programes in the previous week.
The results were found as follows$:\ 1, 6, 2, 3, 5, 12, 5, 8, 4, 8, 10, 3, 4, 12, 2, 8, 15, 1, 17, 6, 3, 2, 8, 5, 9, 6, 8, 7, 14, 2$
$i.$ Make a frequency distribution table for this data, taking class width $5$ and one of the class intervals as $5-10$.
$ii.$ How many children watched television for $15$ or more hours a week.
The following cumulative frequency distribution table shows the daily electricity consumption $($in $KW)$ of $40$ factories in an industrial state.
Consumption $($in $KW)$ No. of factories
Below $240$ $1$
Below $270$ $4$
Below $300$ $8$
Below $330$ $24$
Below $360$ $33$
Below $390$ $38$
Below $420$ $40$
$i.$ Represent this as a frequency distribution table.
$ii.$ Prepare a cumulative frequency table.
$P , Q, R$ and $S$ are respectively the midpoints of the sides $AB, BC, CD$ and $DA$ of a quadrilateral $\text{ABCD}$. Show that:
$i. PQ \| AC$ and $\text{PQ}=\frac{1}{2}\text{AC}$
$ii. PQ \| SR$
$iii. \text{PQRS}$ is a parallelogram.
Draw different pairs of circles. How many points does each pair have in common? What is the maximum number of common points?
Angles $A, B, C$ of a triangle $ABC$ are equal to each other. Prove that $\triangle\text{ABC}$ is equilateral.