Question
What is a budget line? Explain why is it a straight line?

Answer

Budget line is the graphical presentation of the different combinations of good X and good Y which can be purchased with the given money income.

$\text{P}_\text{X}.\text{X}+\text{P}_\text{Y}.\text{Y}=\text{M}$

Where M is Money income.

Px and Py are prices of X and Y respectively and X and Y are quantities of good X and good Y respectively.

Budget line is a straight line because the market rate of exchange (MRE) between the two goods is constant and also because the price of the two goods are constant.

Need a full question paper?

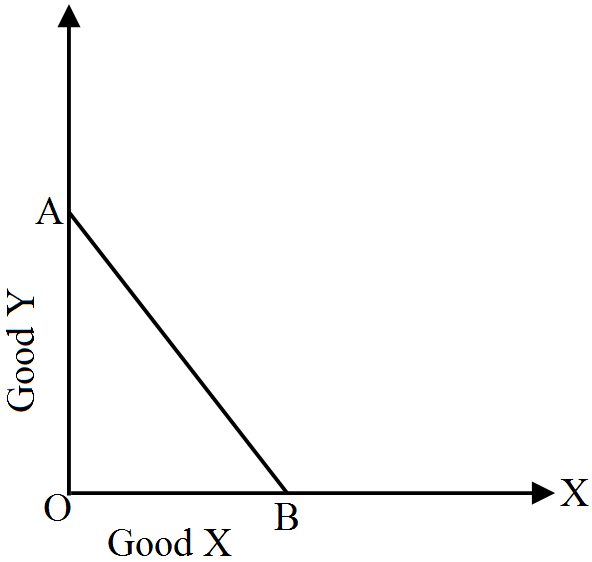
Generate a complete, print-ready paper with questions like this in minutes — across 16+ boards, with answer keys.

Start Generating Free

Similar questions

Does a fall in income have the same effect on demand for the given commodity?
Distinguish between explicit cost and implicit cost and give examples.
In India a majority of population is lying below poverty line due to inequality of 'Income and Wealth'. How can budget be helpful in solving this problem?
Does a change in consumer's taste lead to a movement along the demand curve or a shift in the demand curve? Does a change in price lead to a movement along the demand curve or a shift in the demand curve?
Calculate (a) Net Domestic Product at Factor Cost and (b) Gross National Disposable Income from the following data:
S.No.
Contents
(in crore)
(i)
Net Current Transfers from Rest of the World
(-)60
(ii)
Net Factor Income from Abroad
(-)40
(iii)
Government Final Consumption Expenditure
2,000
(iv)
Private Final Consumption Expenditure
6,000
(v)
Net Domestic Fixed Capital Formation
800
(vi)
Gross Domestic Capital Formation
950
(vii)
Change in Stock
50
(viii)
Net Exports
(-)50
(ix)
Profits
1,000
(x)
Net Indirect Tax
700
Giving reason, classify the into stock or flow.
Imports.
Given the C = 100 + 0.75Y is a consumption function (where C = consumption expenditure and Y-national income) and investment expenditure is ₹ 800. On the basis of this information calculate:
  1. Equilibrium level of national income.
  2. Savings at equilibrium level of national income.
Giving reason comment on the shape of Production Possibilities curve based on thefollowing schedule:
Good X (units)Good Y (units)
010
19
27
34
40
Derive the inverse relation between price of the good and its demand from single commodity equilibrium condition “marginal utility = price”.

OR

Show the demand of a commodity is inversely related to its price. Explain with the help of utility analysis.

What does a zero primary deficit indicates?