Question
What is horizontal analysis of financial statements?
Generate a complete, print-ready paper with questions like this in minutes — across 16+ boards, with answer keys.
|
On Application
|
:
|
₹ 3 per share
|
|
On Allotment
|
:
|
₹ 3 per share (including premium)
|
|
On First Call
|
:
|
₹ 3 per share
|
|
On Second and Final Call
|
:
|
Balance amount
|
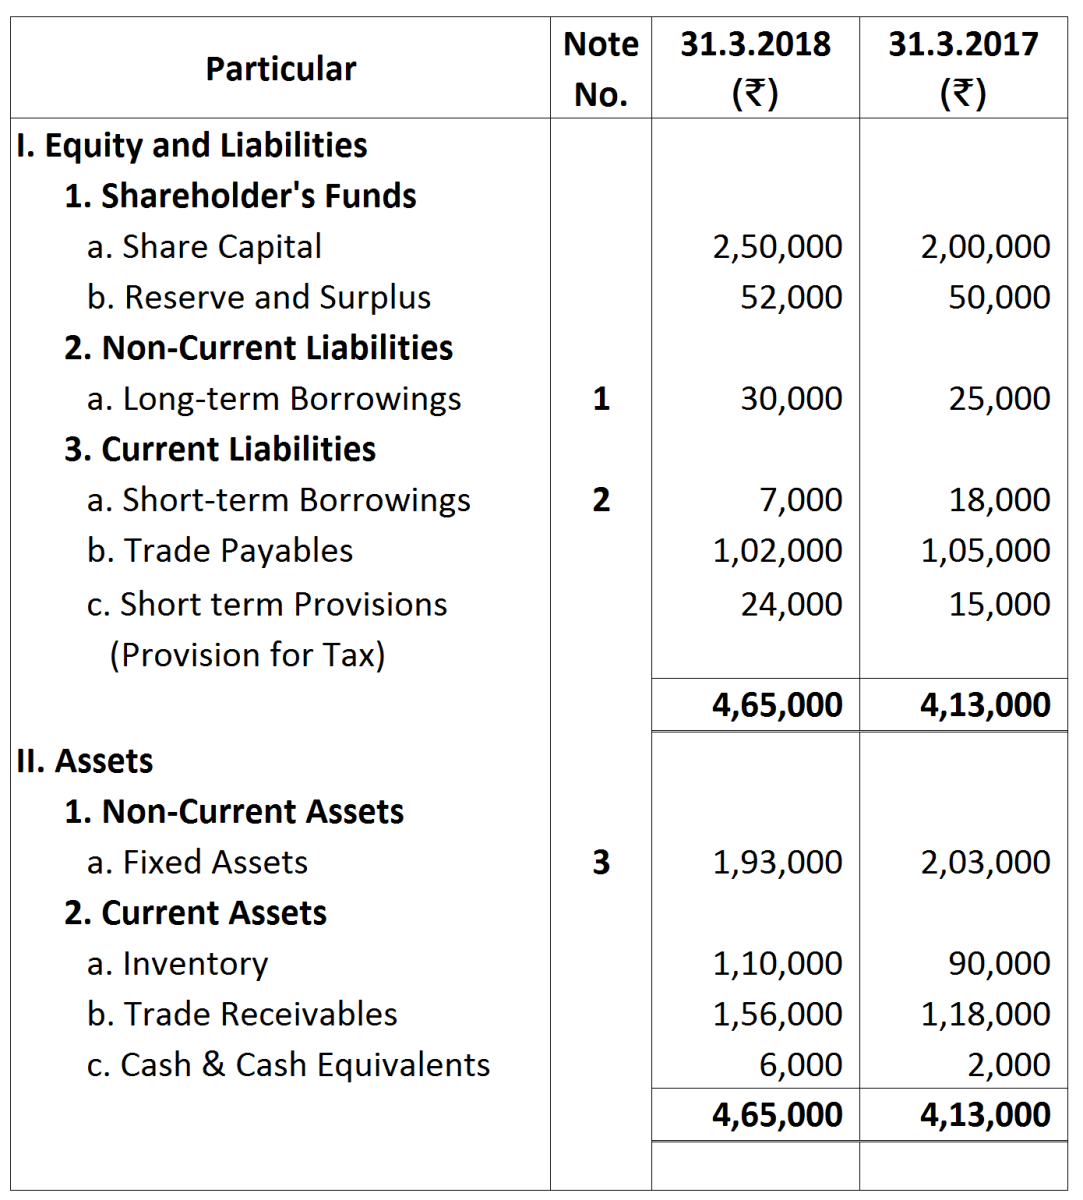 Notes:
  Additional Information:
|
1.
|
Contingent Liability
|
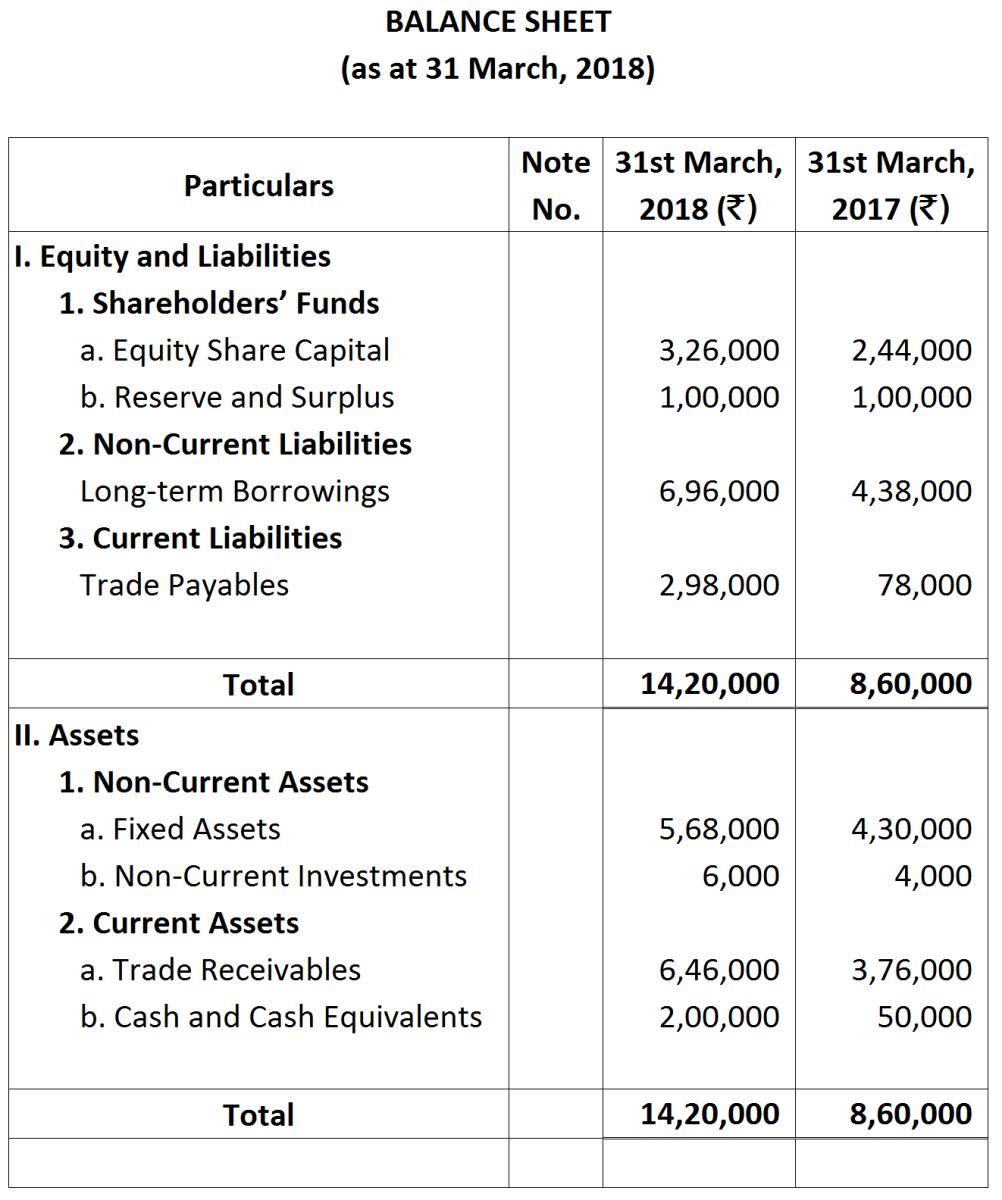
31.3.2018
|
31.3.2017
|
|
|
|
₹
|
₹
|
|
|
Proposed Dividend
|
30,000
|
25,000
|
|
2.
|
Provision for tax made ₹ 30,000.
|
||
|
3.
|
Additional debentures amounting to ₹ 5,000 were issued on 1st Oct. 2017. Interest on debentures has been paid up-to date.
|
||