Theory of consumer behaviour — Economics STD 11 Commerce — Question
CBSE BoardEnglish MediumSTD 11 CommerceEconomicsTheory of consumer behaviour4 Marks
Question
What is Indifference Curve? State three properties of indifference curves.
✓
Answer
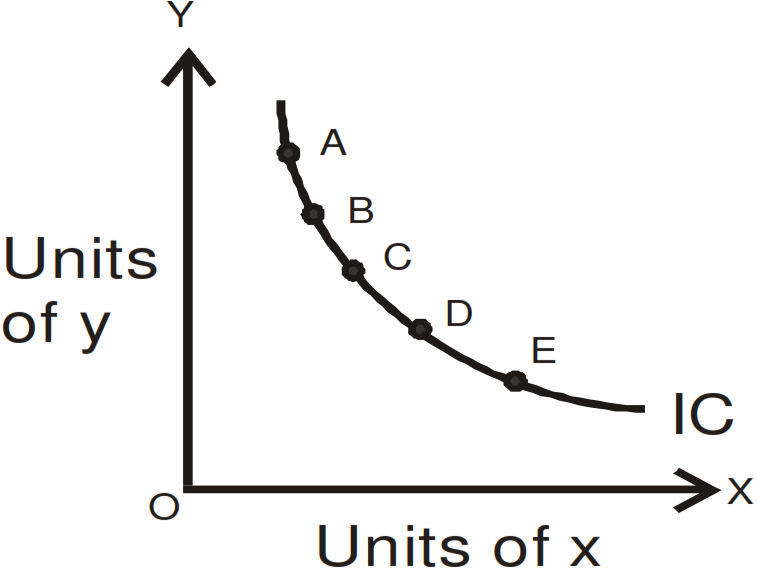
Indifference curve is a form of curve which shows all those combinations of two commodities which provides same level of satisfaction to the consumer, therefore the consumer is indifferent or neutral among chosing any of these combinations. He does not prefer any of the combination over the other combination because all of these combination provides same level of satisfaction. In the present diagram A, B, C, D and E combinations provides same level of satisfaction. Three properties of indifference curves are as follows:-
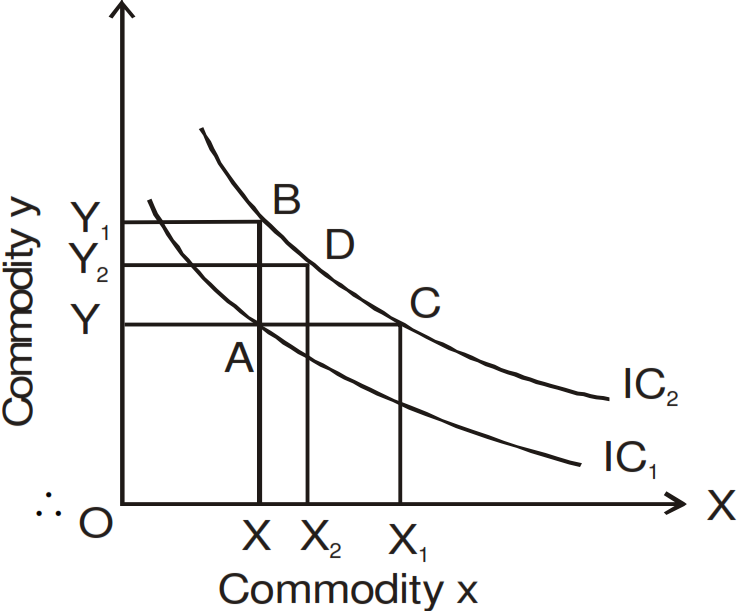
Higher indifference curve represents higher level of satisfaction: Higher indifference curve shows higher level of satisfaction in comparison to lower indifference curve, because along the higher indifference curve we are using more units of one commodity with the same units of another commodity or more units of both the commodities. Therefore the satisfaction level of such combinations will be more.
As in the present diagram:
At A combination $\rightarrow OX + OY$
At B combination $\rightarrow OX + OY_1$
$\therefore$ $B > A$
At C combination $\rightarrow OX_1 + OY$
$\therefore$ $C > A$
At D combination $\rightarrow OX_2 + OY_2$
$\therefore$ $D > A$
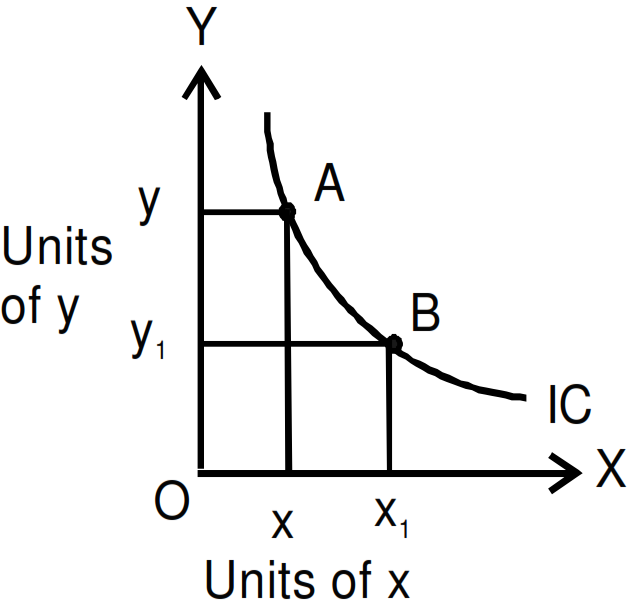
Indifference curves are negative sloping: Indifference curves are always slopes downwards to the right or negative sloping, because if consumer increases units of one commodity, then to maintain the same level of satisfaction consumer has to decrease the units of another commodity. So as the units of X is increased then units of Y has to be decreased and vice-versa. Due to this negative relationship indifference curves are downward sloping.
As in the present diagram as consumer moves from A to B the combination changes from $OX + OY$ to $OX_1 + OY_1$. While moving from A to B, units of X is increased and units of Y is decreased.
Slope of indifference curve will never be horizontal, vertical or upward sloping because in all these three cases, the basic feature of indifference curve, i.e., same level of satisfaction is derived at different points along the same indifference curve, is neglected.
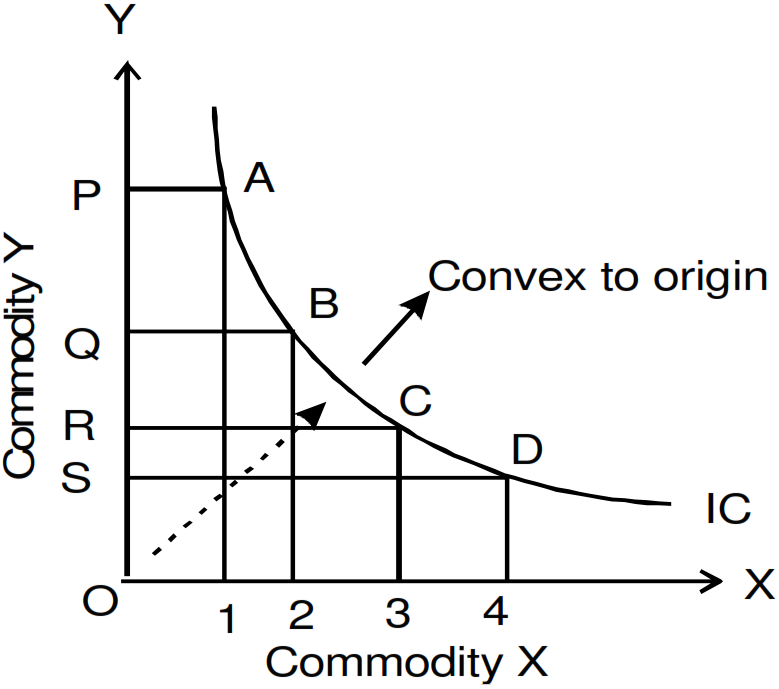
Indifference curves are convex towards the origin: Indifference curves are convex towards the origin because marginal rate of substitution continously decreases (because as the stock of one commodity decreases its marginal importance for the consumer will continously increases and as the stock of another commodity increases its marginal importance for the consumer will continously decreases, therefore he is ready to sacrifice lesser and lesser units of one commodity for the every extra unit of another commodity to maintain the same level of satisfaction).
As shown in the diagram when consumer increases one unit of X commodity he decreases Y commodity equal to PQ, whereas for next unit of X commodity he decreases Y commodity equal to QR. As we can see that PQ > QR, it represents that $MRS_{xy}$ is decreasing and due to that indifference curve will become convex towards the origin.
Need a full question paper?
Generate a complete, print-ready paper with questions like this in minutes — across 16+ boards, with answer keys.