MCQ
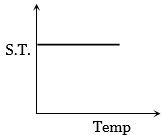
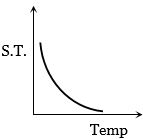
Which graph represents the variation of surface tension with temperature over small temperature ranges for water
- A
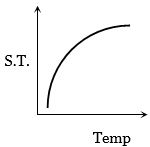
- ✓
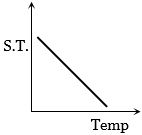
- C
- D
Generate a complete, print-ready paper with questions like this in minutes — across 16+ boards, with answer keys.
An observer located near these two sources of sound will hear