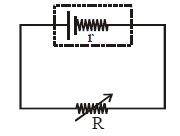
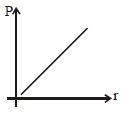
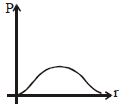
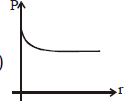
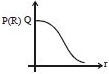
Which of the following graphs represent the variation of power loss in the external load with external resistance $R$?
- A
- B
- C
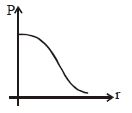
- D
Medium


Download our appand get started for free
Experience the future of education. Simply download our apps or reach out to us for more information. Let's shape the future of learning together!No signup needed.*
Similar Questions
- 1The temperature dependence of resistances of $Cu$ and undoped $Si$ in the temperature range $300-400\ K$, is best described byView Solution
- 2For a cell terminal $P.D.$ is $2.2\;V$ when circuit is open and reduces to $1.8\;V$ when cell is connected to a resistance of $R = 5\,\Omega $. Determine internal resistance of cell $(r)$ is then ........ $\Omega$View Solution
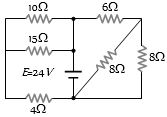
- 3Find the equivalent resistance across the terminals of source of $e.m.f$. $24\, V$ for the circuit shown in figure .............. $\Omega$View Solution
- 4View SolutionSelect the correct statement
- 5The current in a conductor is expressed as $I=3 t^2+4 t^3$, where $I$ is in Ampere and $t$ is in second. The amount of electric charge that flows through a section of the conductor during $t=1$ s to $t=2 \mathrm{~s}$ is_______ C.View Solution
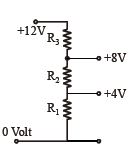
- 6A potential divider is used to give outputs of $4\,V$ and $8\,V$ from a $12\,V$ source. Which combination of resistances, $(R_1 : R_2 : R_3)$ gives the correct voltagesView Solution
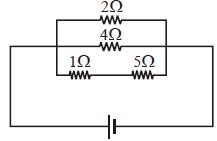
- 7A current of $3\,amp$ flows through the $2\,\Omega $ resistor shown in the circuit. The power dissipated in the $5\,\Omega $ resistor is ................. $watt$View Solution
- 8Two wires '$A$' and '$B$' of the same material have their lengths in the ratio $1 : 2$ and radii in the ratio $2 : 1$. The two wires are connected in parallel across a battery. The ratio of the heat produced in '$A$' to the heat produced in '$B$' for the same time isView Solution
- 9View SolutionTwo resistors having equal resistances are joined in series and a current is passed through the combination. Neglect any variation in resistance as the temperature changes. In a given time interval
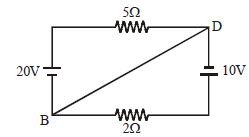
- 10Calculate the current in wire $BD$ ................ $A$View Solution