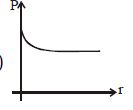
Which of the following graphs represent the variation of power loss in the external load with external resistance $R$?
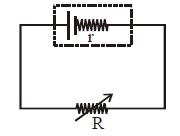
- A
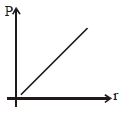
- B
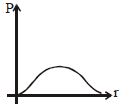
- C
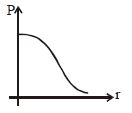
- D
Medium


Download our appand get started for free
Experience the future of education. Simply download our apps or reach out to us for more information. Let's shape the future of learning together!No signup needed.*
Similar Questions
- 1An electric heater of resistance $6 \,ohm$ is run for $10$ minutes on a $120\, volt$ line. The energy liberated in this period of time isView Solution
- 2A button battery is rated $3 \,V$ and $225 \,mAh . A$ cricket ball (mass $=0.163 \,kg$ ) having energy equal to that stored in the battety will have speed closest to ............ $\,m / s$View Solution
- 3A $50\,V$ battery is connected across a $10\, ohm$ resistor. The current is $4.5\, amperes$. The internal resistance of the battery is ............. $ohm$View Solution
- 4In $n_e$ and $v_d$ be the number of electrons and drift velocity in a semiconductor. When the temperature is increasedView Solution
- 5In a conductor $4$ coulombs of charge flows for $2$ seconds. The value of electric current will beView Solution
- 6Two wires have resistance of $2$ $\Omega$ and $4$ $\Omega$ connected to same voltage, ratio of heat dissipated at resistance isView Solution
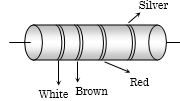
- 7In the figure a carbon resistor has bands of different colours on its body as mentioned in the figure. The value of the resistance is ................. $k \Omega$View Solution
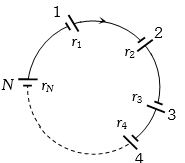
- 8A group of $N$ cells whose $emf$ varies directly with the internal resistance as per the equation $E_N = 1.5\, r_N$ are connected as shown in the figure below. The current $I$ in the circuit is ........... $amp$View Solution
- 9In the arrangement of resistances shown below, the effective resistance between points $A$ and $B$ is ............... $\Omega$View Solution
- 10The resistors of resistances $2$ $\Omega$, $4$ $\Omega$ and $8$ $\Omega$ are connected in parallel, then the equivalent resistance of the combination will beView Solution