Gujarat BoardEnglish MediumSTD 12 ScienceMathsFunctions2 Marks
Question
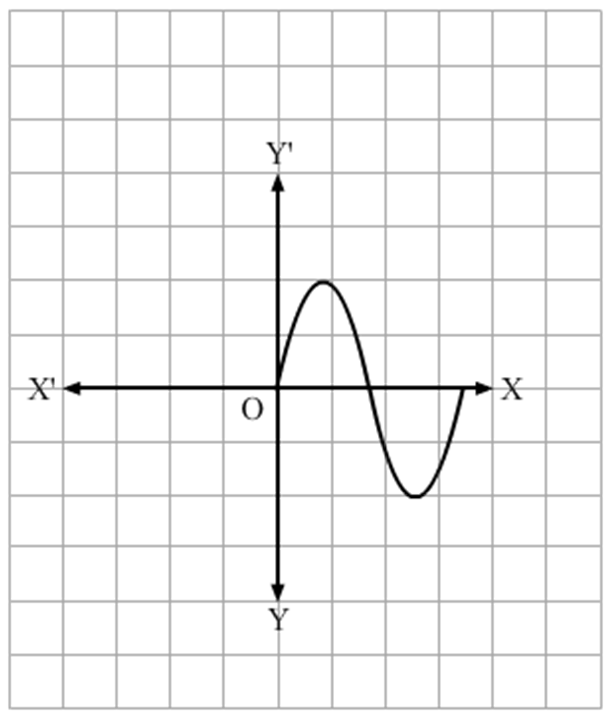
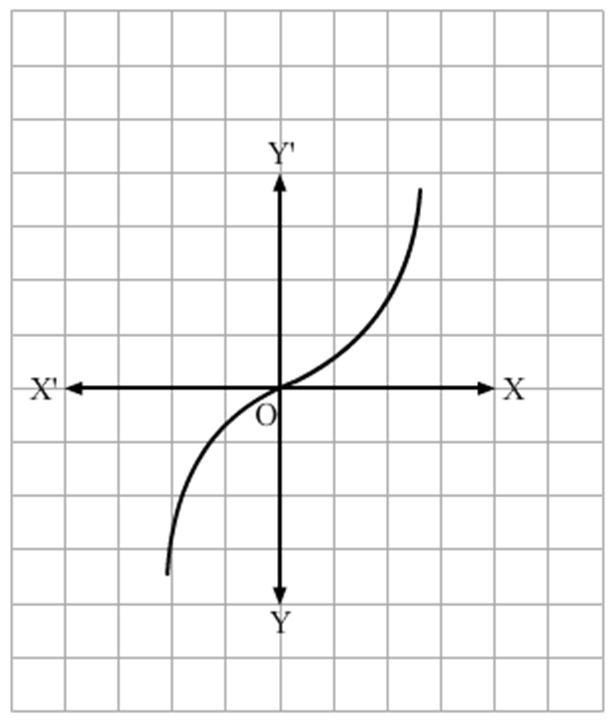
Which of the following graphs represents a one-one function?
✓
Answer
In the graph of (b), different elements on the x-axis have different images on the y-axis. But in (a), the graph cuts the x-axis at 3 points, which means that 3 points on the x-axis have the same image as O and hence, it is not one-one.
Need a full question paper?
Generate a complete, print-ready paper with questions like this in minutes — across 16+ boards, with answer keys.