MCQ
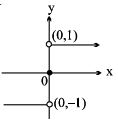
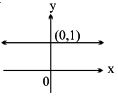
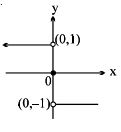
Which one of the following best represents the graph of the function $f(x) =\mathop {Lim}\limits_{n \to \infty } \,\,\frac{2}{\pi }\,{\tan ^{ - 1}}\left( {nx} \right)$
- ✓
- B
- C
- D
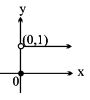
If $x>0$ then $n x$ tends to infinite and $\tan ^{-1} \infty=\pi / 2$
So lim tends to $1 .$
If $x=0$ then $n x$ becomes 0 and $\tan ^{-1} 0=0$
so, lim becomes 0.
If $x<0$ then $n x$ tends to negative infinite and $\tan ^{-1}-\infty=-\pi / 2$
So lim tends to -1 .
Generate a complete, print-ready paper with questions like this in minutes — across 16+ boards, with answer keys.